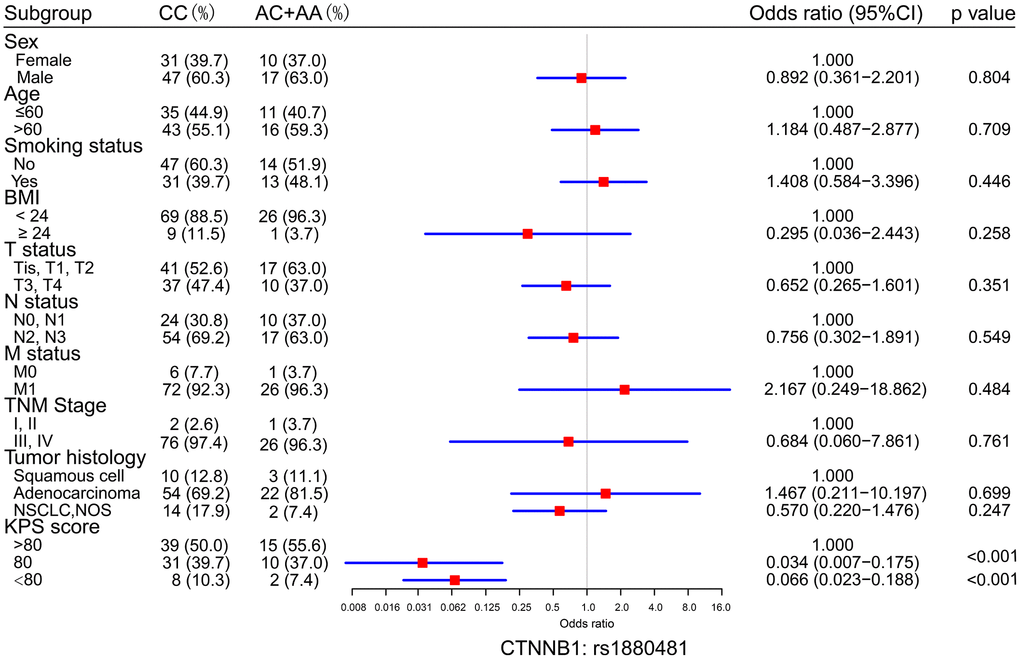
Figure 3.Logistic regression analysis of the differences in the distribution of clinical characteristics between the CC genotypes and the AC+AA genotypes of CTNNB1: rs1880481. The odds ratio (OR) with 95% confidence interval (CI) was estimated by logistic regression analysis.