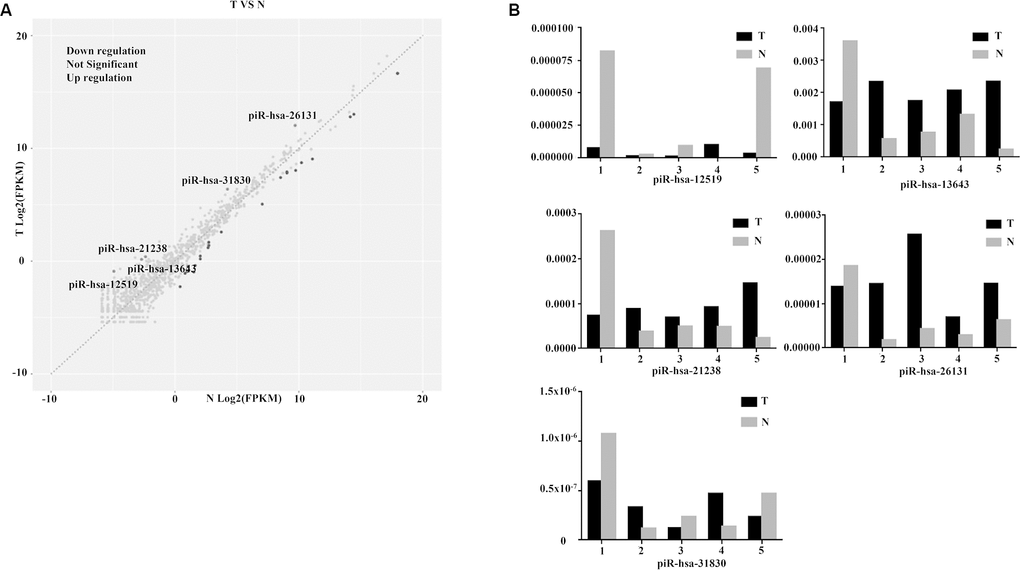
Figure 3.Diagnostic performance of piR-13643 and piR-21238 in the screening phase of the study. (A) The scatter plot was used for assessing the piRNAs expression variation. (B) Based on the results of NGS, five piRNAs (piR-31830, piR-13643, piR-26131, piR-12519, piR-21238) were chosen as potential endogenous controls for normalization of RT-qPCR data.