Submit an Article
Navigate
Home
Editorial Board
Editorial Policies
Current Volume
Archive
Scientific Integrity
Publication Ethics Statements
Interviews with Outstanding Authors
Newsroom
Sponsored Conferences
Podcast
Contact
Special Collections
Submit an Article
Online ISSN: 1945-4589
Research Paper
|
Volume 12, Issue 10
|
pp. 9260–9274
Integrative analysis of genomic and epigenetic regulation of endometrial cancer
Back to article
Figure 6
(6 of 8)
−
100%
+
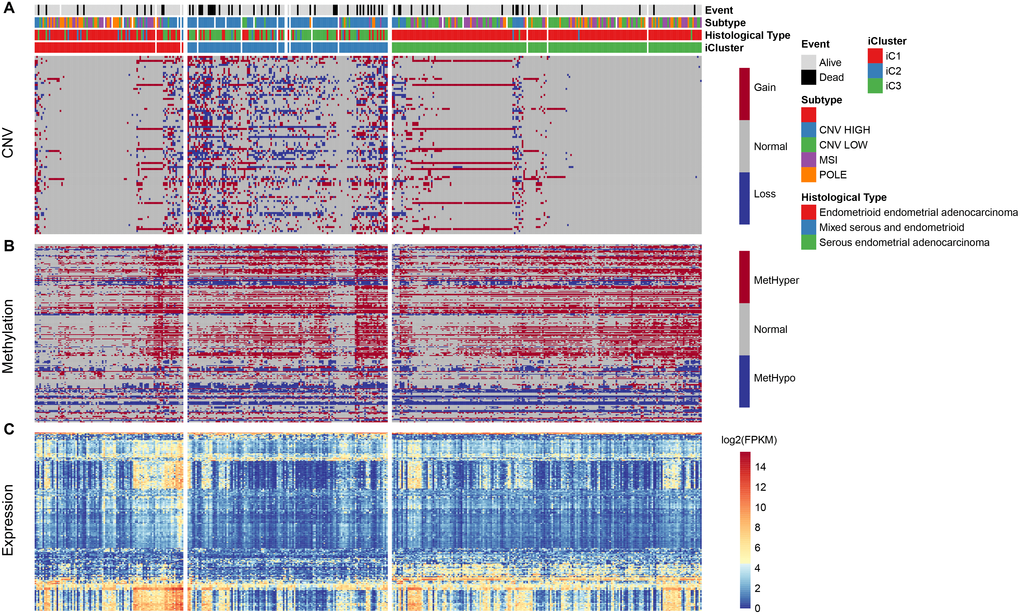
Figure 6.
(
A
) Distribution pattern for CNV in iCluster. (
B
) Distribution for methylation level in iCluster. (
C
) Heatmap of differentially expressed genes in iCluster subtypes.