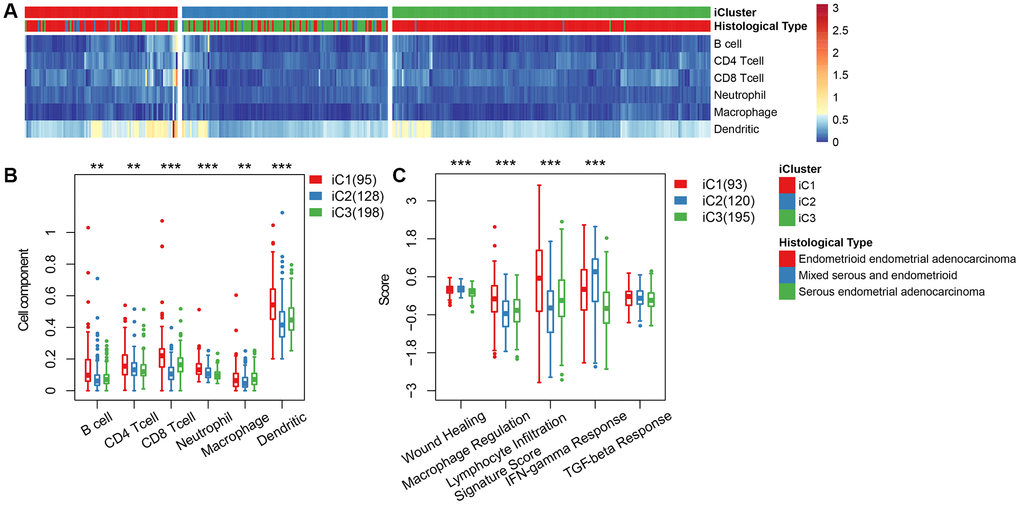
Figure 5.(A) Immune cell scores obtained from all samples. (B) A comparison of all immune cell scores among the three subtypes of iCluster. (C) A comparison of 5 immune signatures scores.
Figure 5 — Integrative analysis of genomic and epigenetic regulation of endometrial cancer | Aging