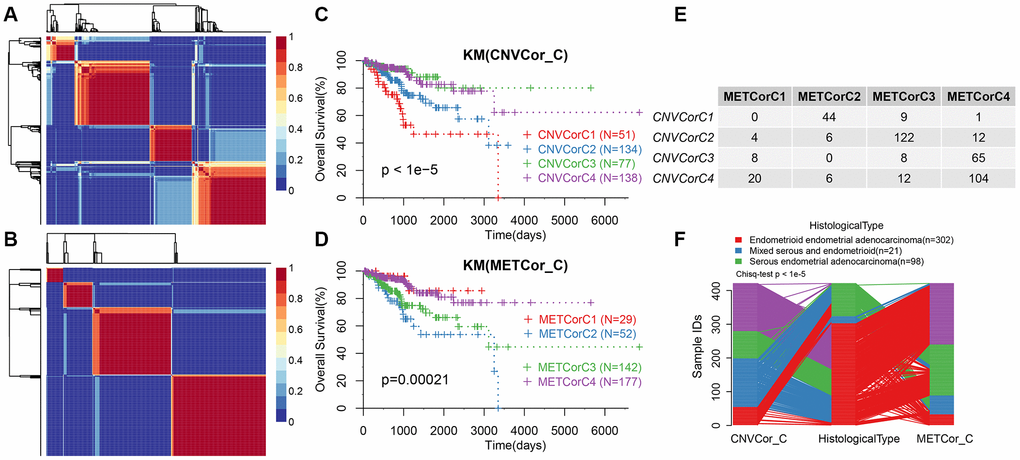
Figure 2.Molecular subtypes based on CNV-G and MET-G genes. (A) NMF-based clustering of CNV-G. (B) NMF-based clustering of MET-G. (C) KM survival curve of CNV-G subtype. (D) KM survival curve of MET-G subtype. (E) The overlap between the CNV-G subtype and the MET-G subtype. (F) The overlap between the CNV-G subtype, the MET-G subtype and the histological subtype.