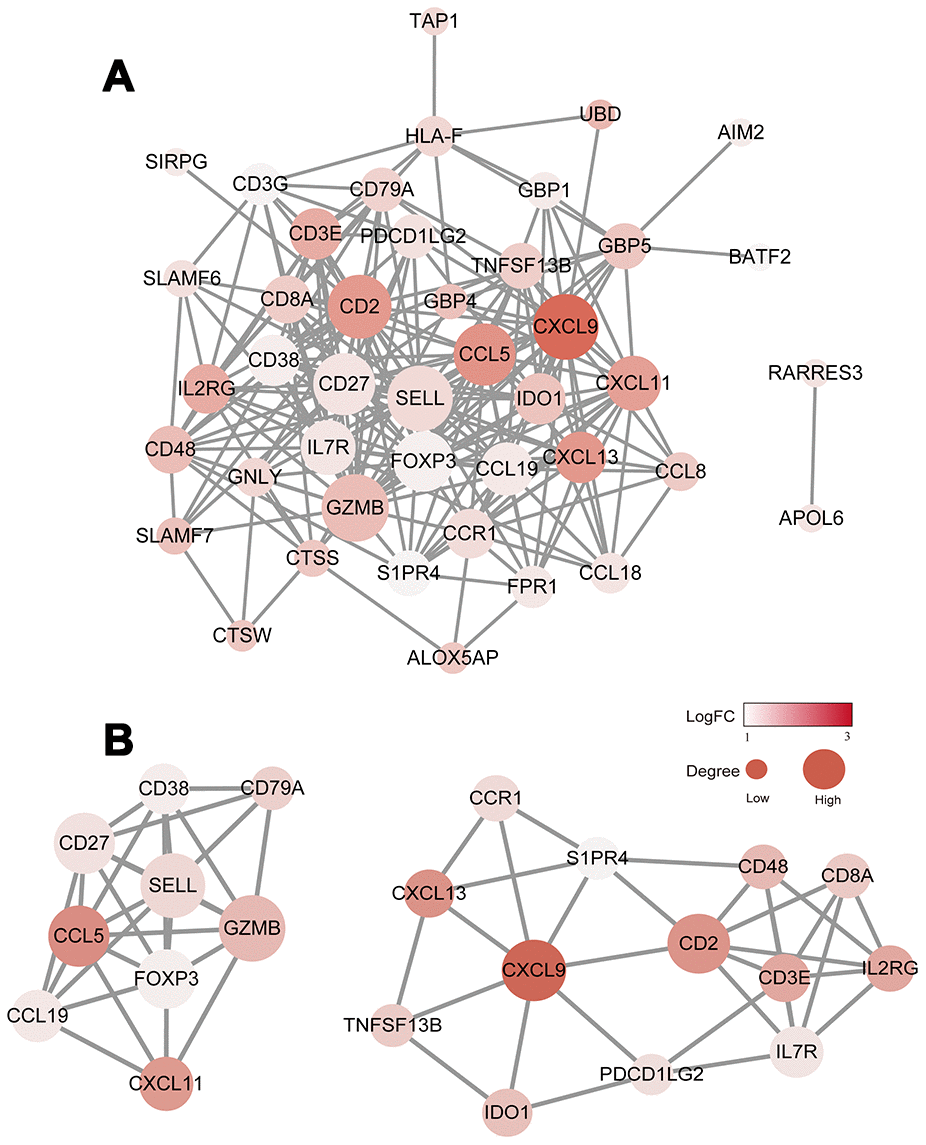
Figure 4.Construction of the PPI network for the 48 prognostic DEGs. (A) The PPI network was constructed using the 48 prognostic DEGs with the R software package STRINGdb. (B) MCODE was used to identify the main coregulated modules. The most significant module is indicated in two closely related subgroups.