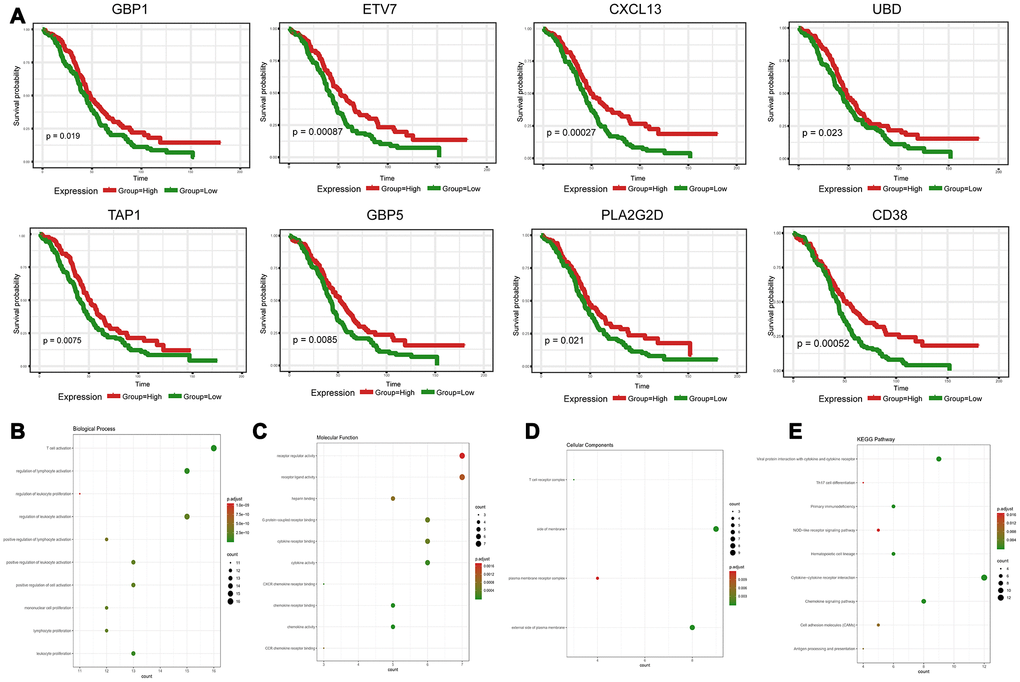
Figure 3.Discovery of prognostic TME-related DEGs with functional annotations in TCGA. (A) Kaplan-Meier survival curves were generated for selected DEGs with prognostic significance by a log-rank test. OS=overall survival time in months. (B–E) GO term and KEGG pathway analyses with the 48 prognostic DEGs.