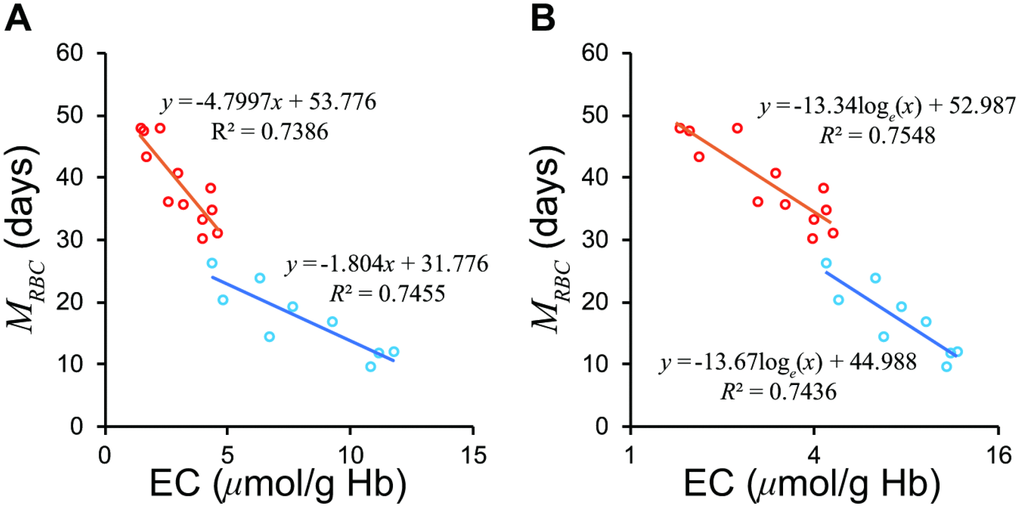
Figure 3.Relationship between EC and MRBC in the groups with severe and mild hemolytic disease. (A) The two groups show differing regression lines on a normal scale. (B) The two groups are unified on a semi-logarithmic scale. The Red circles represent mild group, sky blue the severe group according to Fehr et al. [13]. EC, erythrocyte creatine; MRBC, mean erythrocyte age.
Figure 3 — A novel method for calculating mean erythrocyte age using erythrocyte creatine | Aging