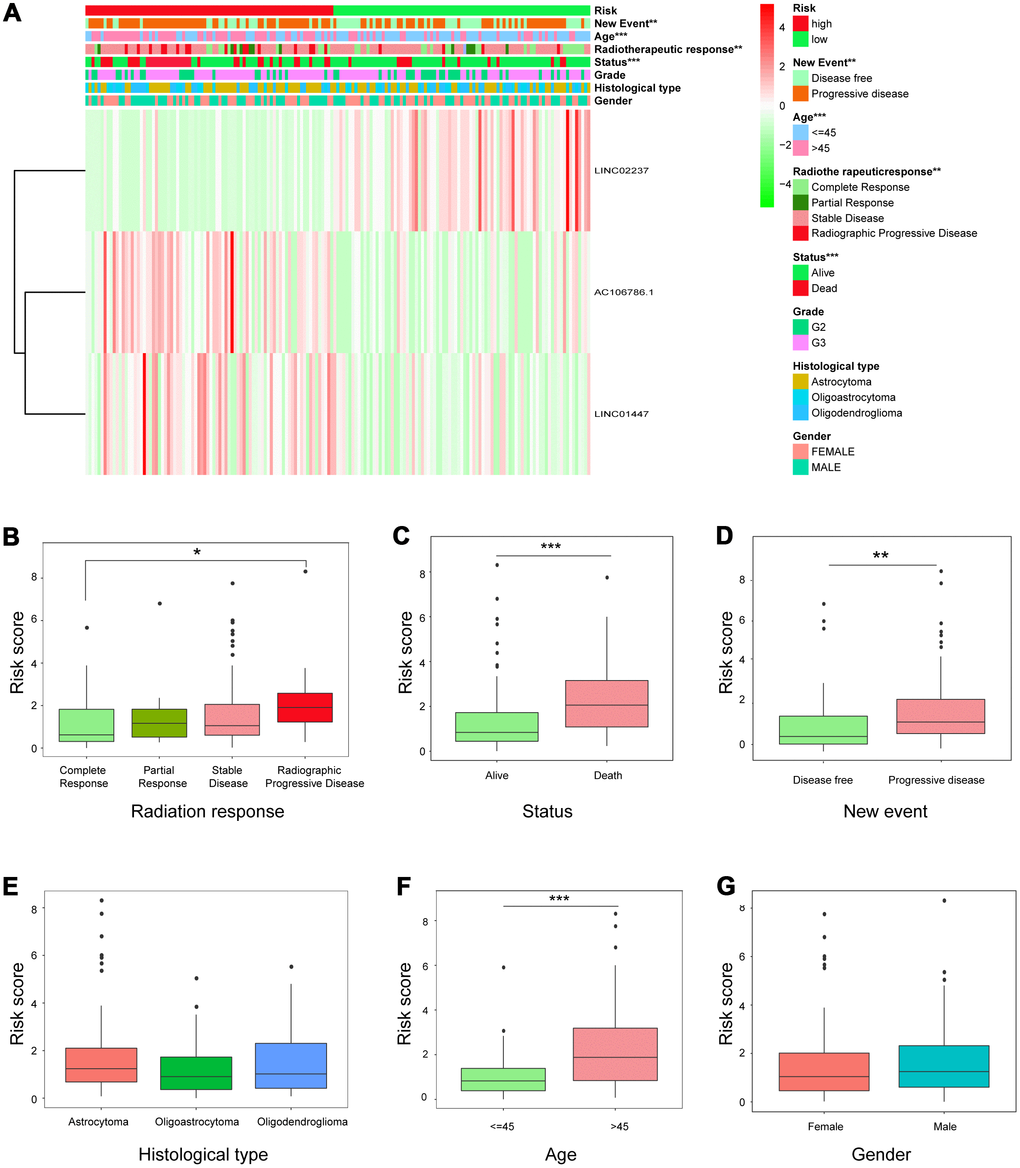
Figure 5.Relationship between risk score and clinicopathological features. (A) Heatmap showing the expression of the three lncRNAs in low- and high-risk groups; distributions of clinicopathological features were compared between the low- and high-risk groups. (B–G) Risk score distributions when patients were stratified by (B) radiation response, (C) status, (D) new event, (E) histological type, (F) age, and (G) gender.