Submit an Article
Navigate
Home
Editorial Board
Editorial Policies
Current Volume
Archive
Scientific Integrity
Publication Ethics Statements
Interviews with Outstanding Authors
Newsroom
Sponsored Conferences
Podcast
Contact
Special Collections
Submit an Article
Online ISSN: 1945-4589
Research Paper
|
Volume 12, Issue 10
|
pp. 9151–9172
Downregulation of miRNA-146a-5p promotes malignant transformation of mesenchymal stromal/stem cells by glioma stem-like cells
Back to article
Figure 5
(5 of 9)
−
100%
+
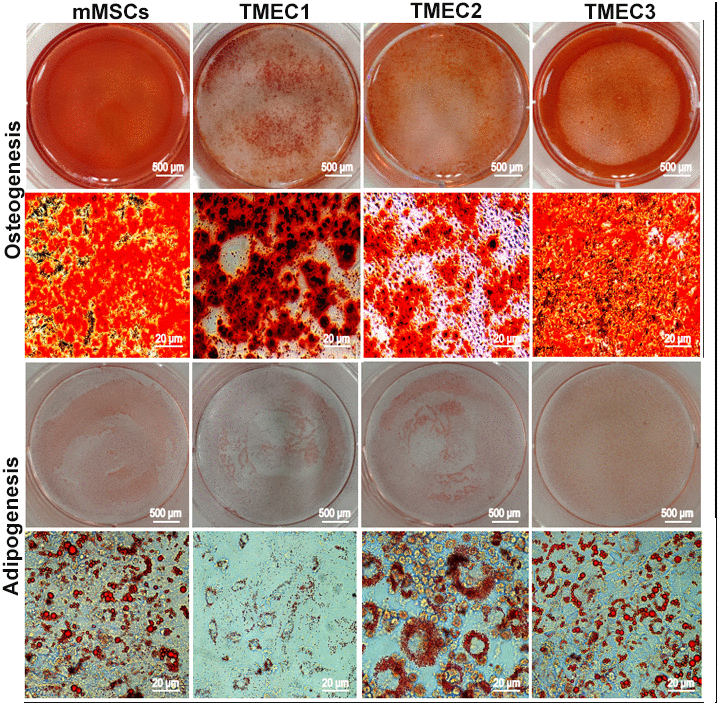
Figure 5.
Osteogenic and adipogenic differentiation assays in tMSCs.
Scale bars: 20 μm.