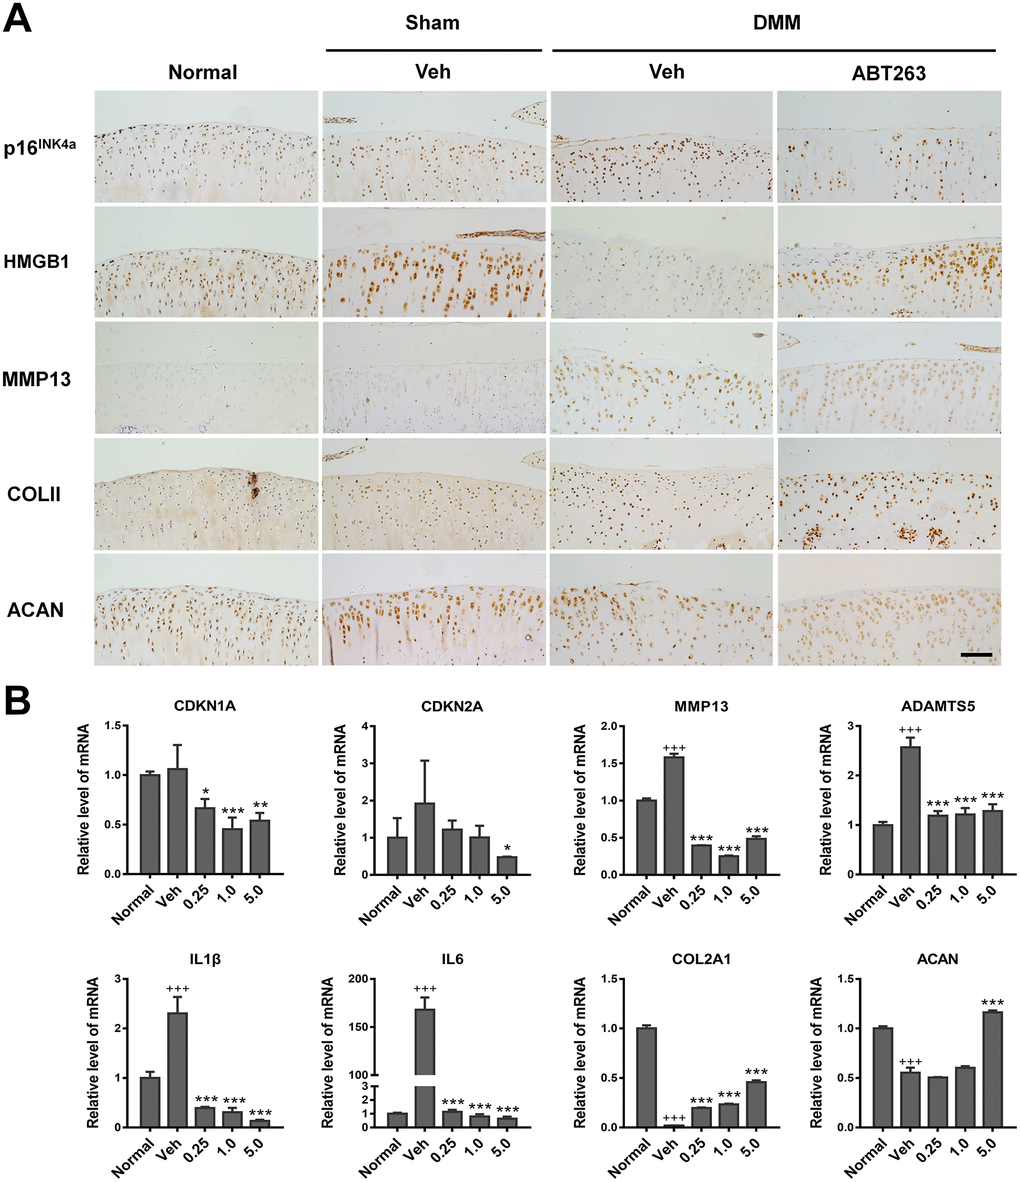
Figure 9.Elimination of SnCs by ABT263 and alleviation inflammatory microenvironment in vivo. (A) immunohistochemical analysis for expression of p16INK4a, HMGB1, COLII and ACAN of rat cartilage after 2 weeks intra-articular injection of ABT263. Result from ABT263 of 1.0 mM was presented. Scale bar: 100 μm. (B) mRNA level analysis using real-time qPCR for CDKN1A, CDKN2A, MMP13, ADAMTS5, IL1β, IL6, COLII and ACAN in the rat knee joint. Data are shown as mean ± standard deviation. N = 3 per group. +p<0.05 with respect to normal group; *p<0.05 with respect to vehicle group.