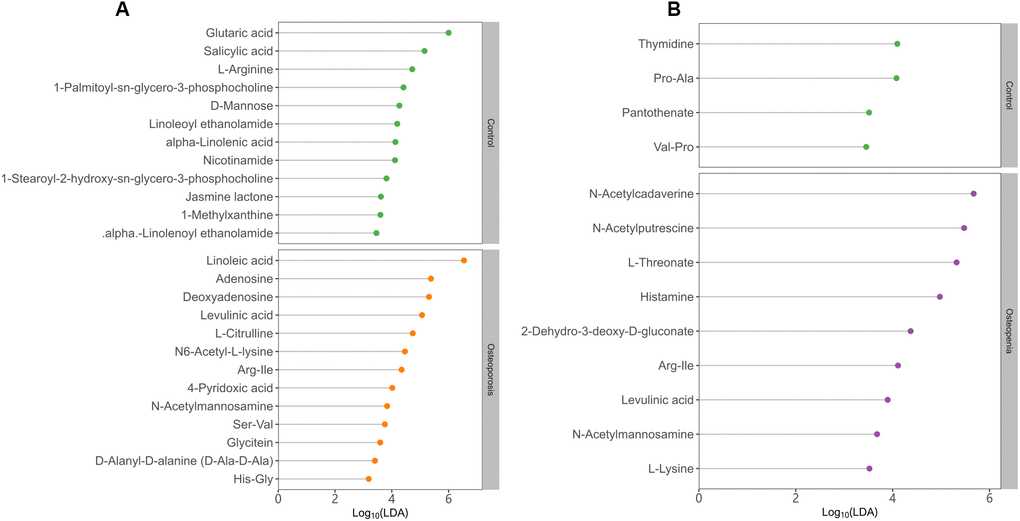
Figure 4.Discriminative fecal metabolites between postmenopausal osteopenia and control. (A), As well as between postmenopausal osteoporosis and control (B). The x-axis shows the logarithms (base 10) of LDA (Linear discriminant analysis). The y-axis shows the discriminative fecal metabolites.