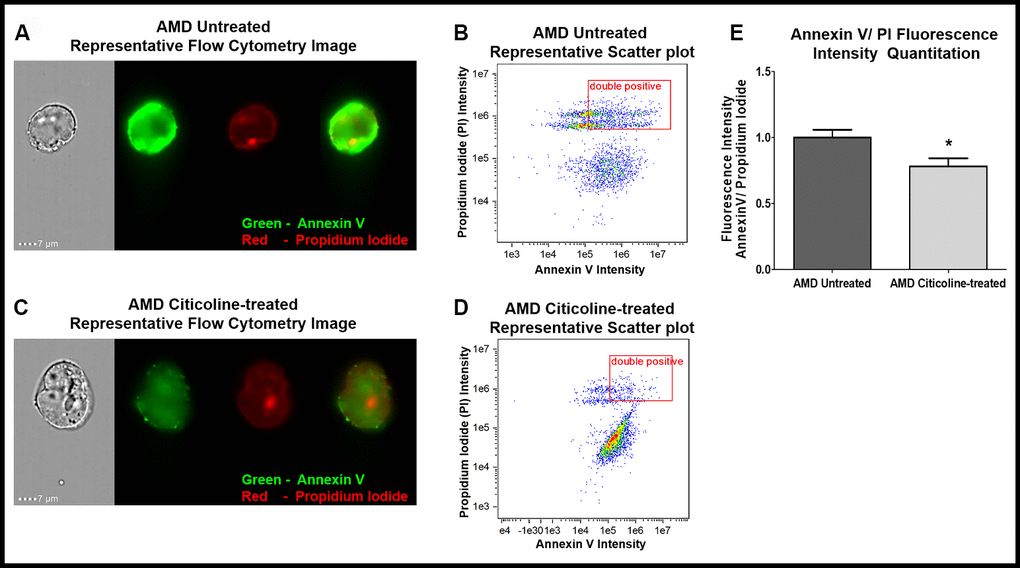
Figure 1.(A) AMD Untreated cells’ Representative Annexin V/ PI staining flow cytometry image; (B) AMD Untreated cells’ Representative Annexin V/ PI fluorescence intensity scatter plot; (C) AMD Citicoline-treated cells’ Representative Annexin V/ PI staining flow cytometry image; (D) AMD Citicoline-treated cells’ Representative Annexin V/ PI fluorescence intensity scatter plot; (E) AMD Untreated vs. AMD Citicoline-treated Annexin V/ PI fluorescence intensity quantitation.