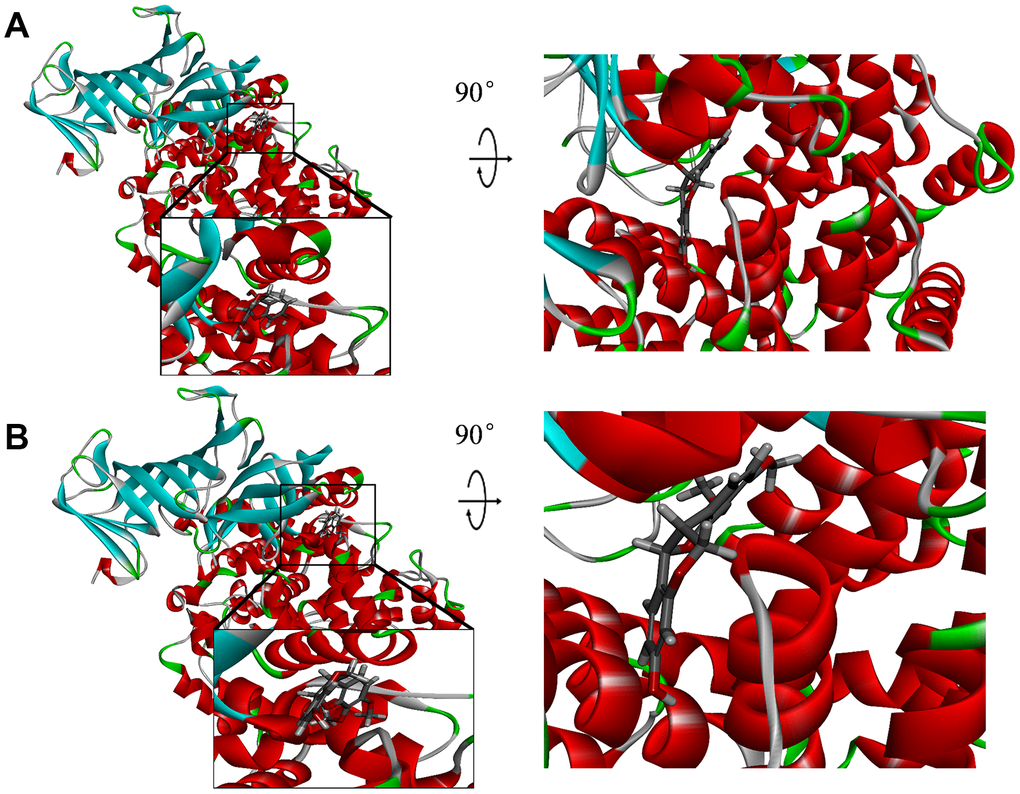
Figure 3.Schematic drawing of interactions between ligands and aminopeptidase N(CD13). Blue represents positive charge; red represents negative charge; and ligands are shown in sticks, with the structure around the ligand-receptor junction shown in thinner sticks. (A) ZINC000014820583-CD13 complex. (B) ZINC000000895551-CD13 complex.