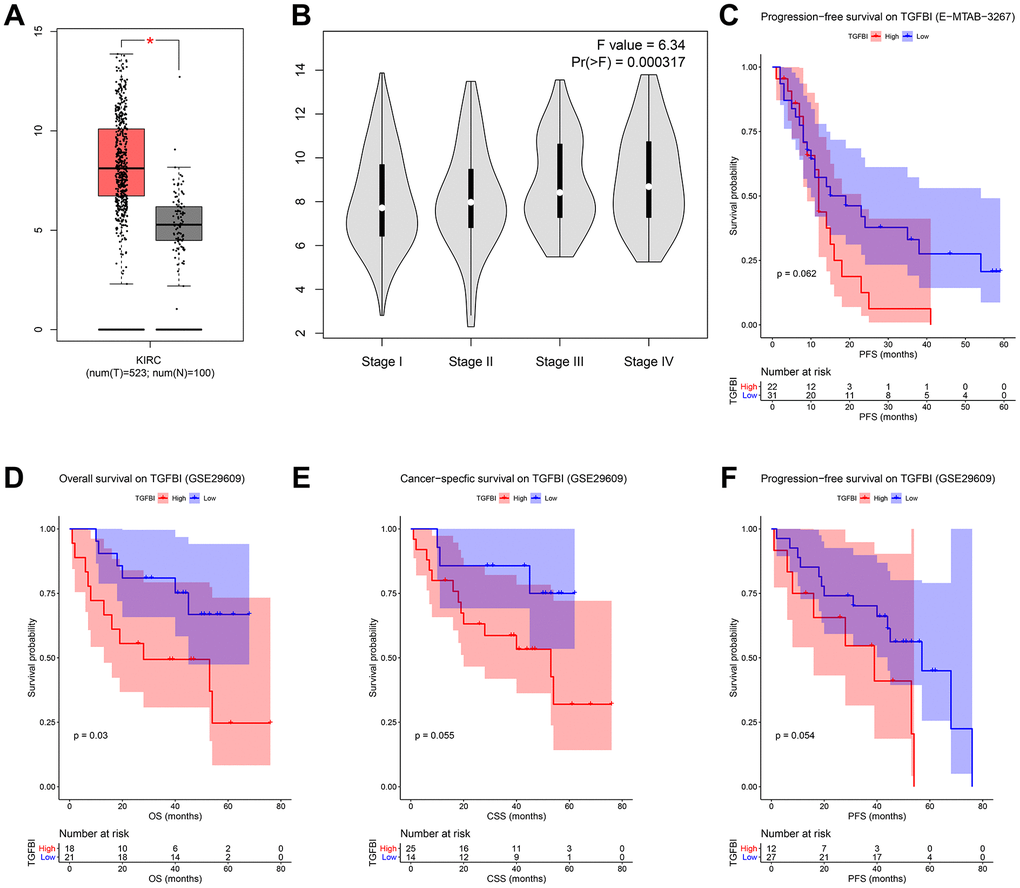
Figure 8.(A) Expression comparison of hub gene in ccRCCs and normal tissues by GEPIA. (B) Stage plot of TGFBI across different pathological stages in the TCGA-KIRC data. (C) Survival analysis of the association between TGFBI expression and progression free survival time in ccRCC (E-MTAB-3267). Survival analysis of the association between TGFBI expression and overall survival (D), cancer specific survival (E), progression free survival (F) time in ccRCC (GSE29609).