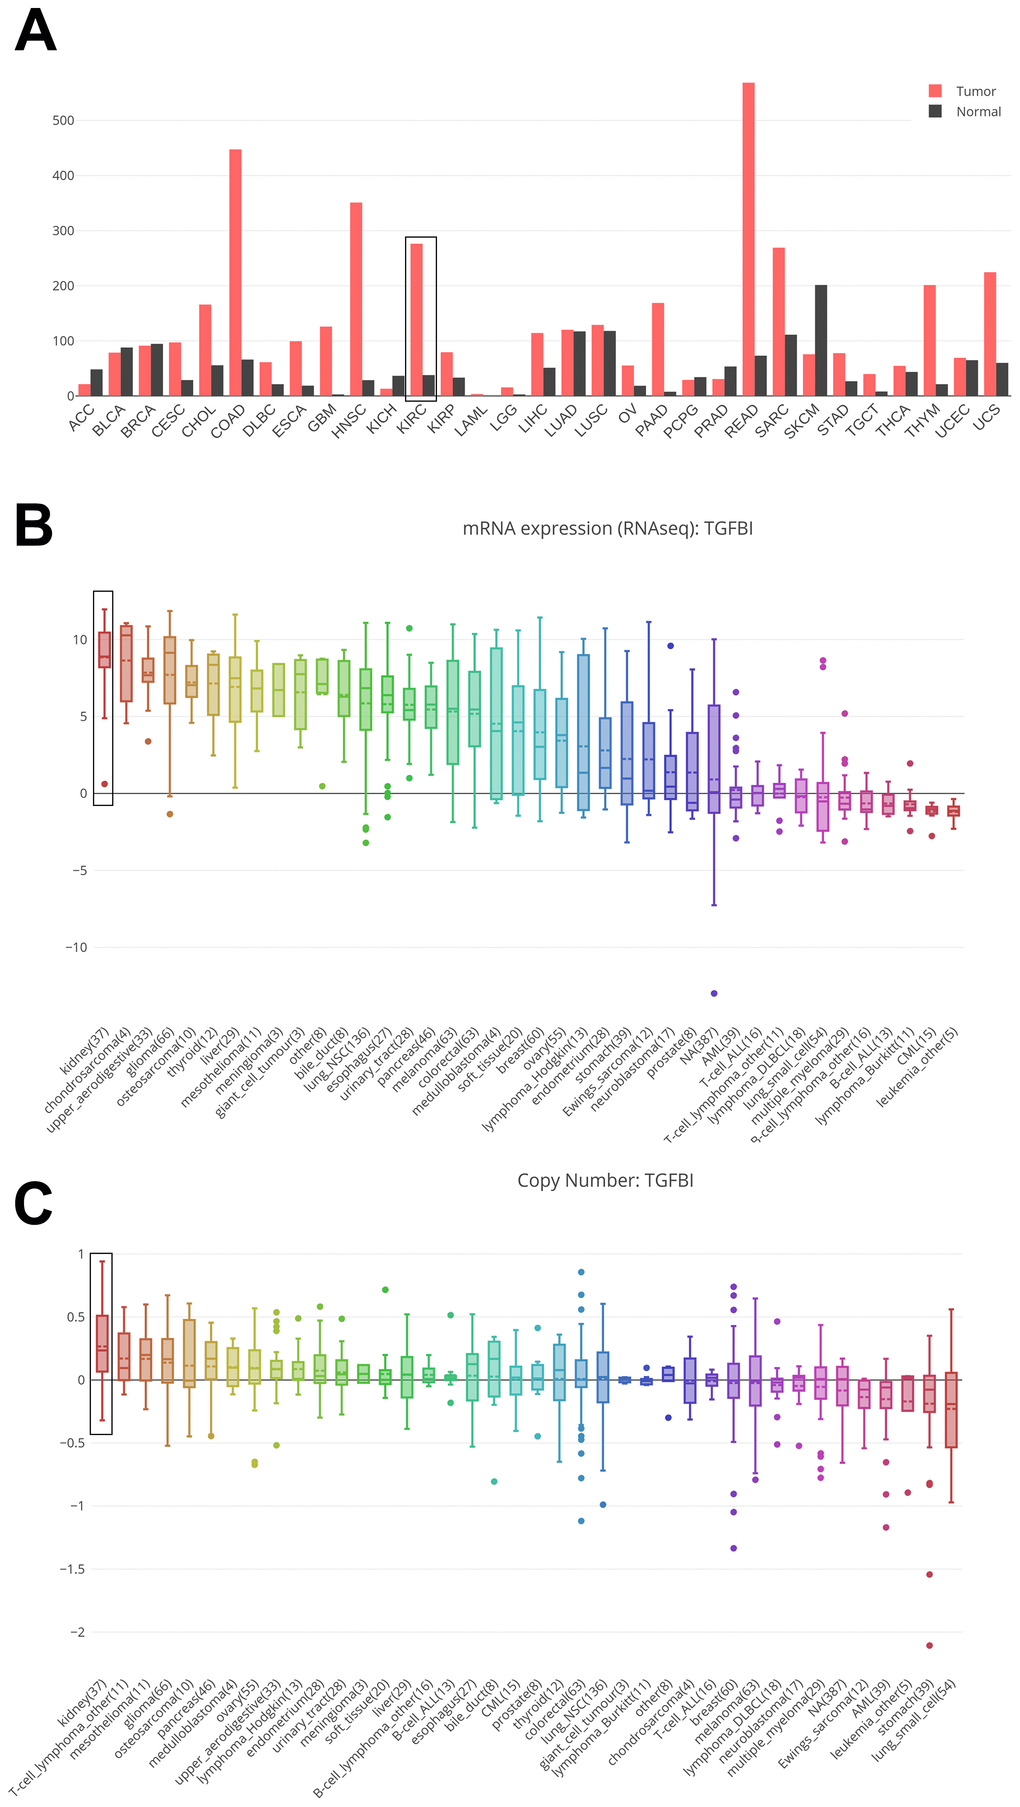
Figure 10.Comparison of TGFBI mRNA expression between tumors and normal tissues across all the types of cancers from TCGA data (A). Cancer Cell Line Encyclopedia analysis of TGFBI mRNA expression (B) and copy number variation level (C) in kidney (black boxes) and other cancer cell lines.