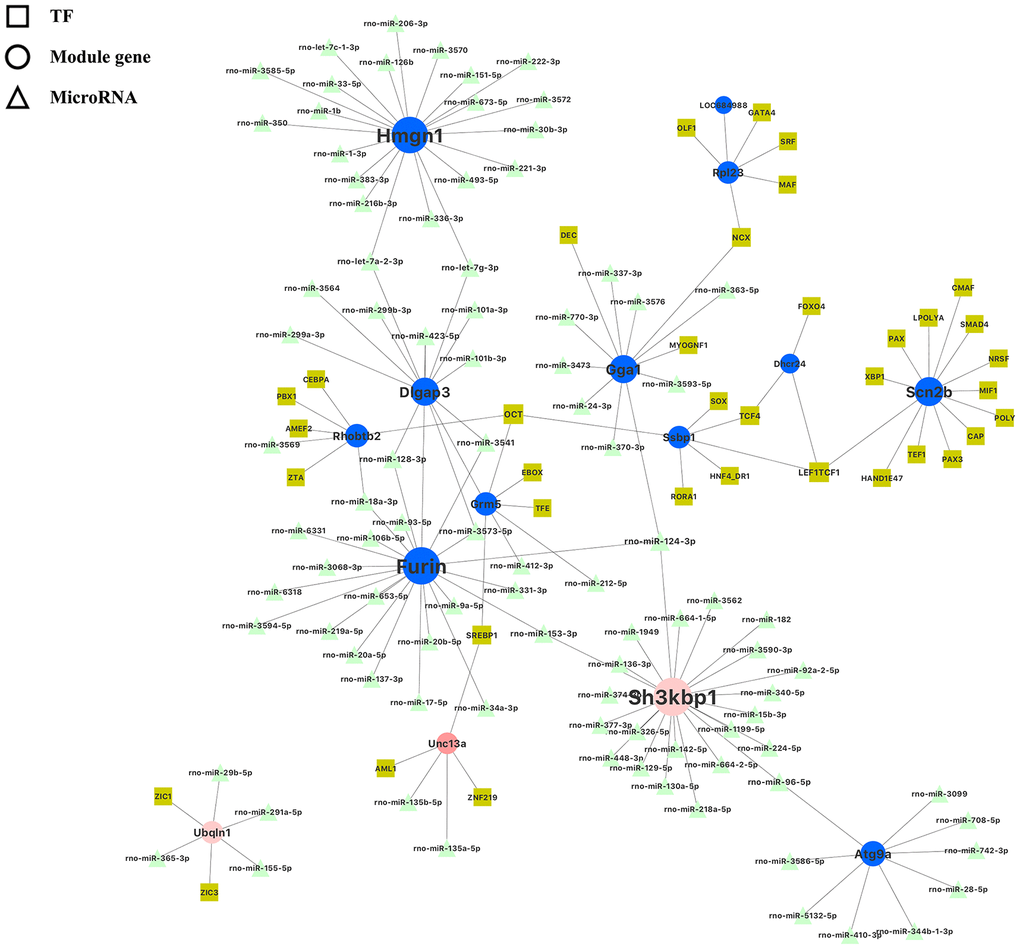
Figure 6.Illustration of miRNA–mRNA-transcription factor interaction for hub genes identified in the blue, pink and salmon modules in the hippocampus. Each hub gene is denoted as solid circle; each transcription factor is denoted as solid square; and each miRNA is denoted as a solid delta.