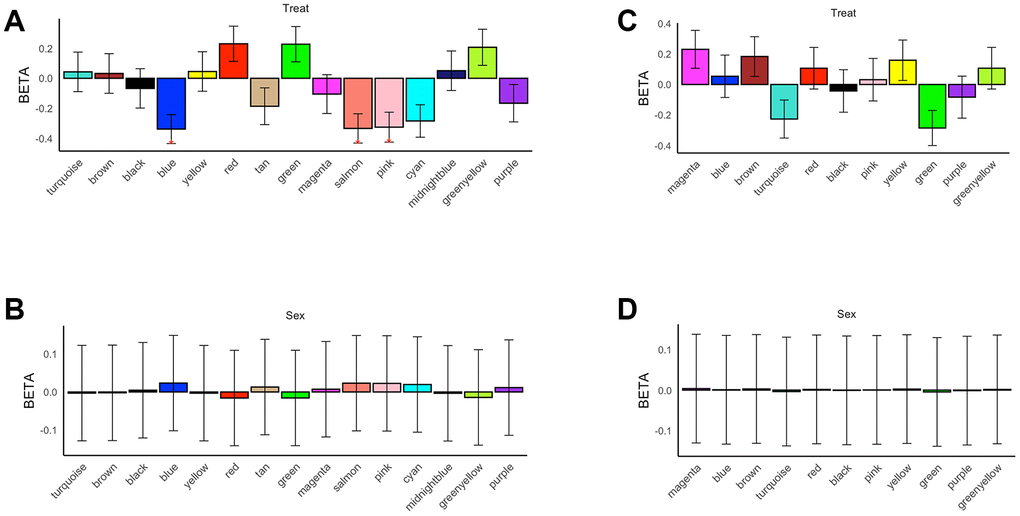
Figure 2.Association test of modules with prenatal nutritional status and gender (FDR-corrected *P < 0.05). (A) Module-level differential expression related to prenatal nutritional status in the hippocampus. (B) Module-level differential expression related to prenatal nutritional status in the prefrontal cortex. (C) Module-level differential expression related to gender status in the hippocampus. (D) Module-level differential expression related to gender status in the prefrontal cortex.