Submit an Article
Navigate
Home
Editorial Board
Editorial Policies
Current Volume
Archive
Scientific Integrity
Publication Ethics Statements
Interviews with Outstanding Authors
Newsroom
Sponsored Conferences
Podcast
Contact
Special Collections
Submit an Article
Online ISSN: 1945-4589
Research Paper
|
Volume 12, Issue 9
|
pp. 8413–8422
LncRNA ILF3-AS1 mediated the occurrence of epilepsy through suppressing hippocampal miR-212 expression
Back to article
Figure 2
(2 of 7)
−
100%
+
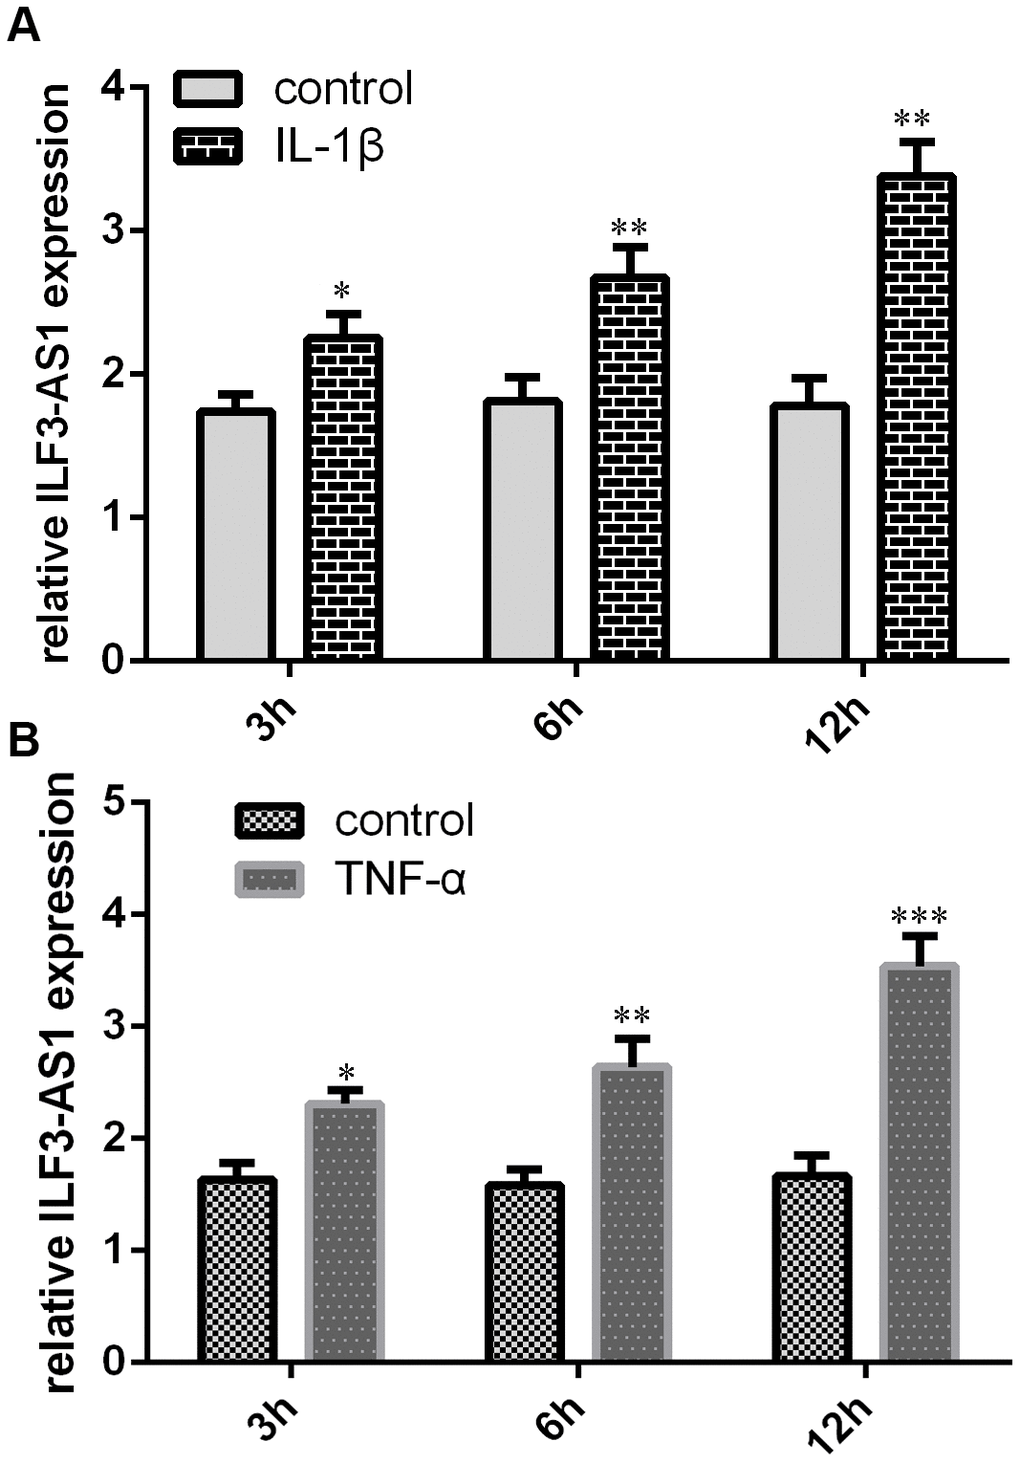
Figure 2.
qRT-PCR analysis showing IL-1β and TNF-α induce ILF3-AS1 expression.
Shown are levels of ILF3-AS1 expression induced by IL-1β (
A
) and TNF-α (
B
) in astrocytes. *p<0.05, **p<0.01, and ***p<0.001.