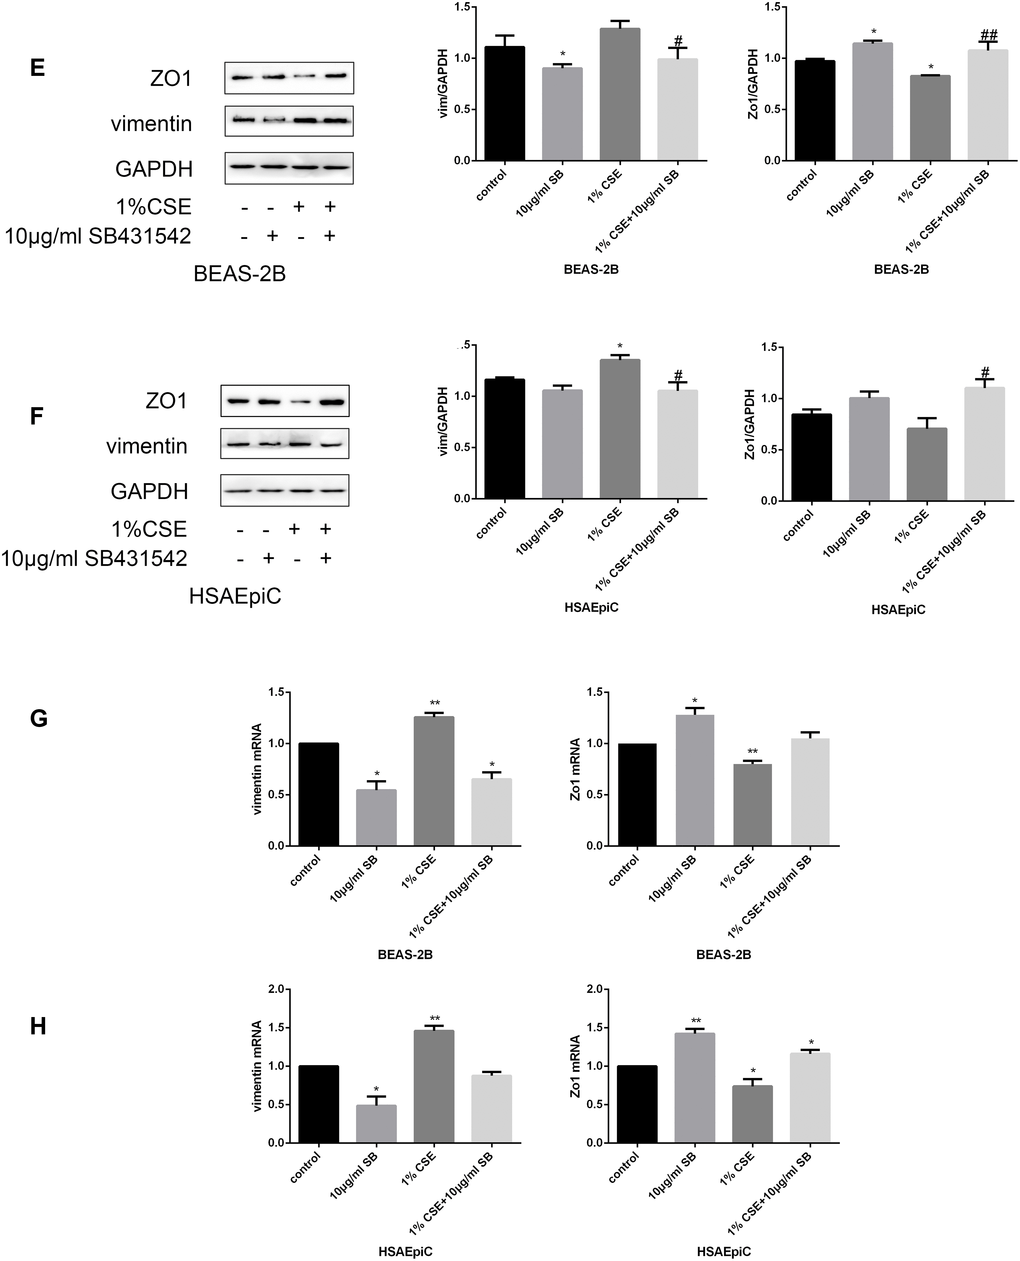
Figure 5E–H.The TGF-β signaling pathway determined the EMT level. (E–H) AECs were treated with 10 μg/mL SB431542 for 30 minutes. Western blots of Zo1 and vimentin in BEAS-2B (E) and HSAEpiC (F) cells. qRT-PCR analyses of Zo1 and vimentin in BEAS-2B (G) and HSAEpiC (H) cells. * p<0.05, ** p<0.01 compared with the control group; # p<0.05, ## p<0.01 compared with the CSE group SB: SB431542.