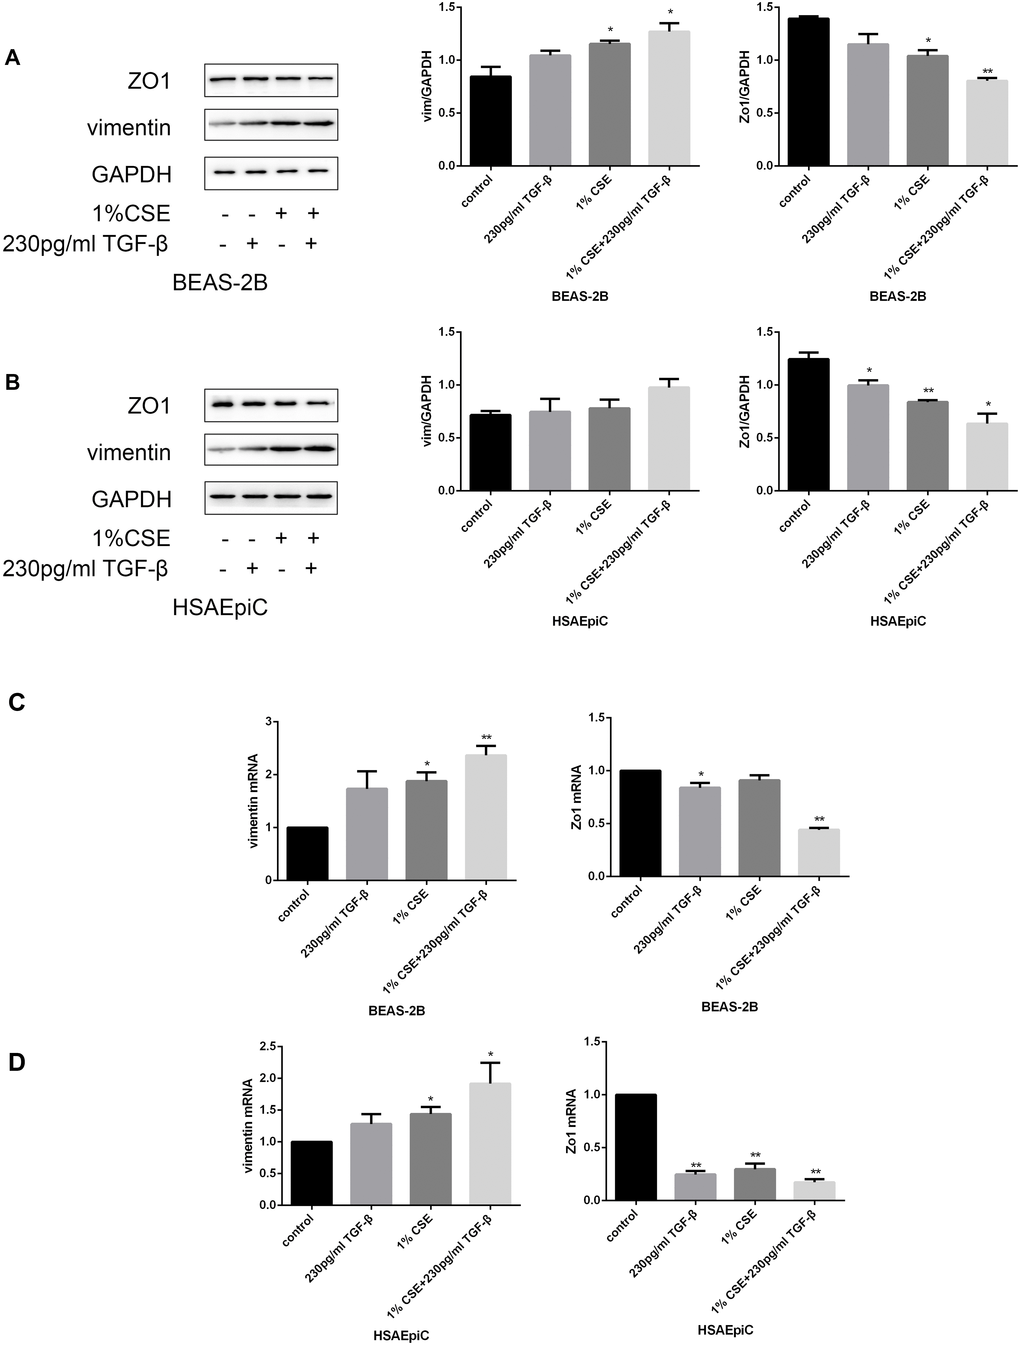
Figure 5A–D.The TGF-β signaling pathway determined the EMT level. (A–D) AECs were treated with 230 pg/mL TGF-β1 for 2 hours. Western blots of Zo1 and vimentin in BEAS-2B (A) and HSAEpiC (B) cells. qRT-PCR analyses of Zo1 and vimentin in BEAS-2B (C) and HSAEpiC (D) cells.