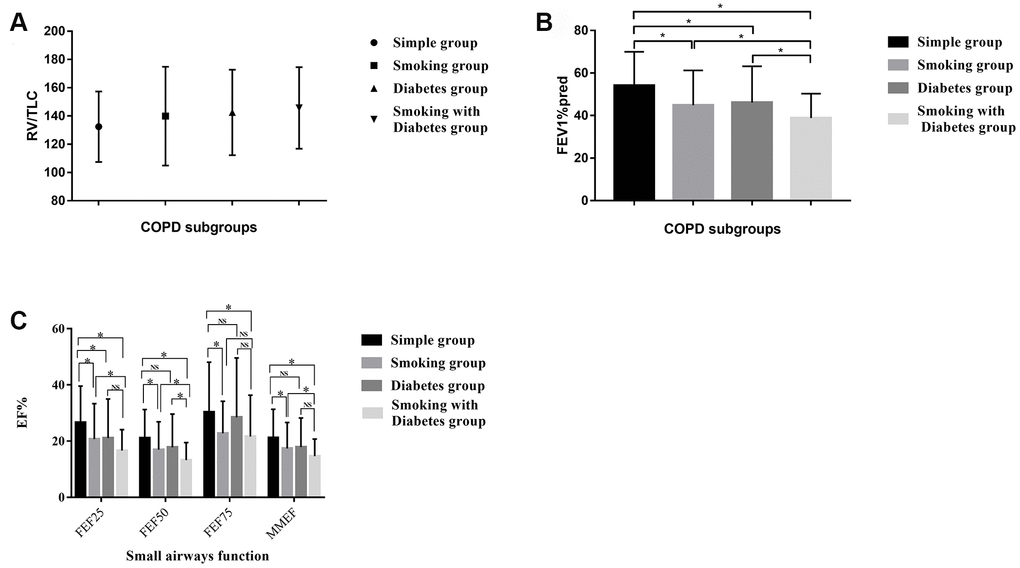
Figure 1.(A) The distribution of the RV/TLC% in the different COPD subgroups. (B) The distribution of the FEV1%pred in the different COPD subgroups. (C) Small airway disorders identified using the pulmonary ventilation test in the different COPD patients. * indicates a significant difference between two groups; NS indicates no significant difference between two groups.