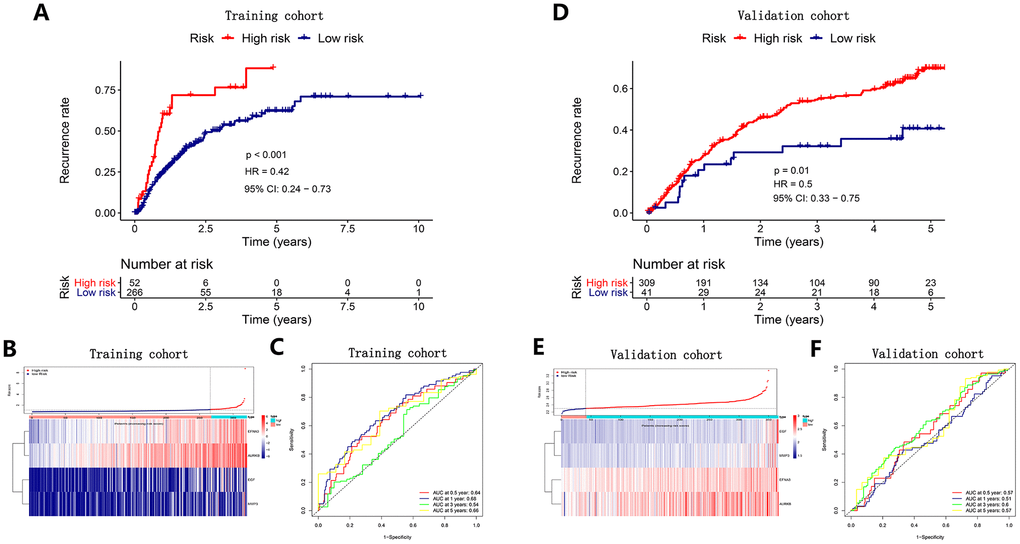
Figure 4.Survival analysis, risk score distribution and time-dependent ROC curves of a recurrence model in the TCGA HCC cohort (A–C) and ICGC HCC cohort (D–F). (A, D) The recurrence rates in the high-risk group was much higher than that in the low-risk group (P<0.05). (B) and E Gene expression levels and corresponding risk scores in HCC patients. (C, F) ROC curve analysis for recurrence prediction.