Submit an Article
Navigate
Home
Editorial Board
Editorial Policies
Current Volume
Archive
Scientific Integrity
Publication Ethics Statements
Interviews with Outstanding Authors
Newsroom
Sponsored Conferences
Podcast
Contact
Special Collections
Submit an Article
Online ISSN: 1945-4589
Research Paper
|
Volume 12, Issue 9
|
pp. 7848–7873
Identification and validation of the angiogenic genes for constructing diagnostic, prognostic, and recurrence models for hepatocellular carcinoma
Back to article
Figure 1
(1 of 12)
−
100%
+
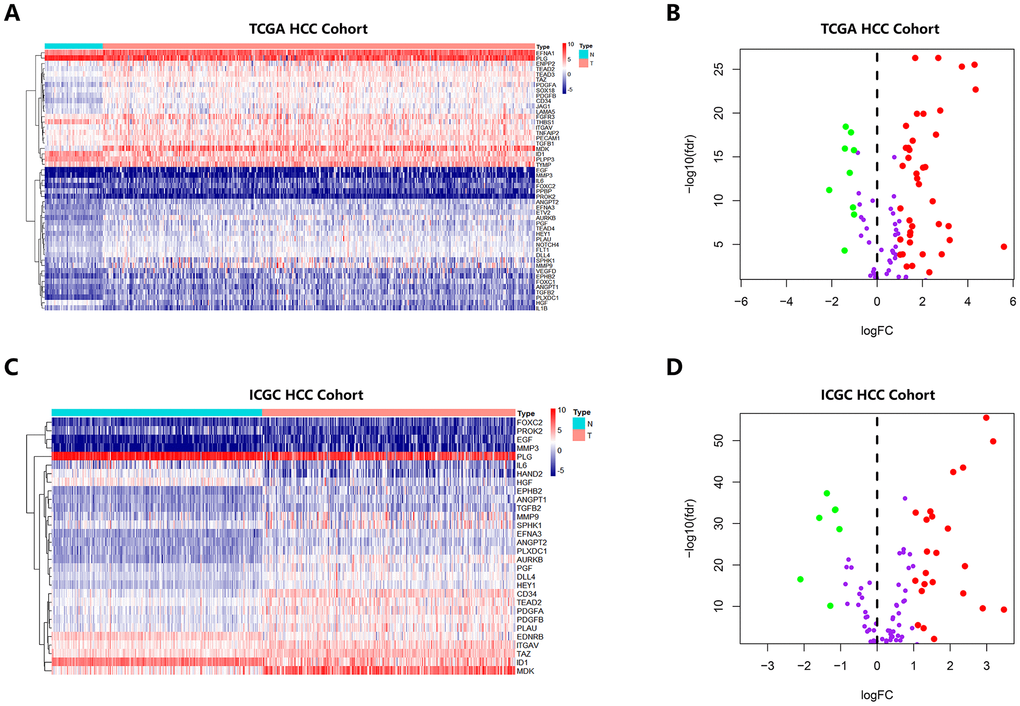
Figure 1.
Heatmap and Volcano Plot showed the differentially expressed angiogenic genes of HCC patients in different database.
(
A
,
B
) Gene expression features in the TCGA database. (
C
,
D
) Gene expression levels in the ICGC database.