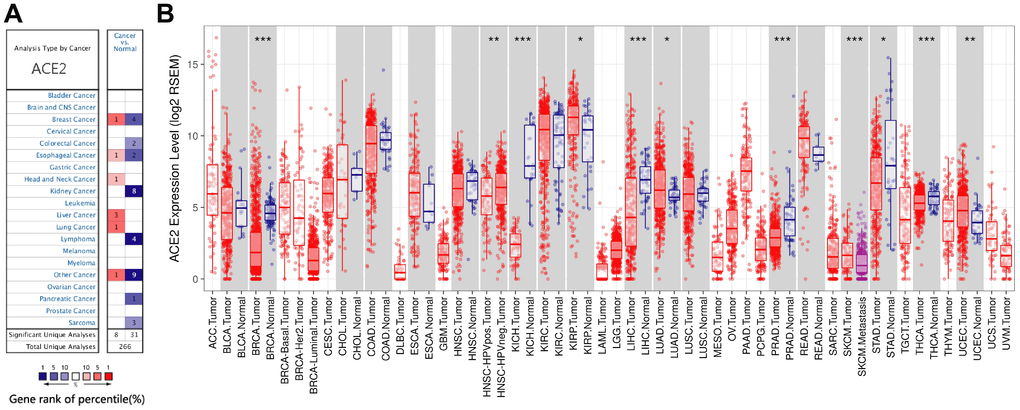
Figure 1.The expression levels of ACE2 in different cancers. (A) ACE2 in different cancers compared to normal tissues in the Oncomine database. (B) ACE2 expression levels of different tumor types in the TCGA database were detected by TIMER (*P<0.05, **P<0.01, ***P<0.001).