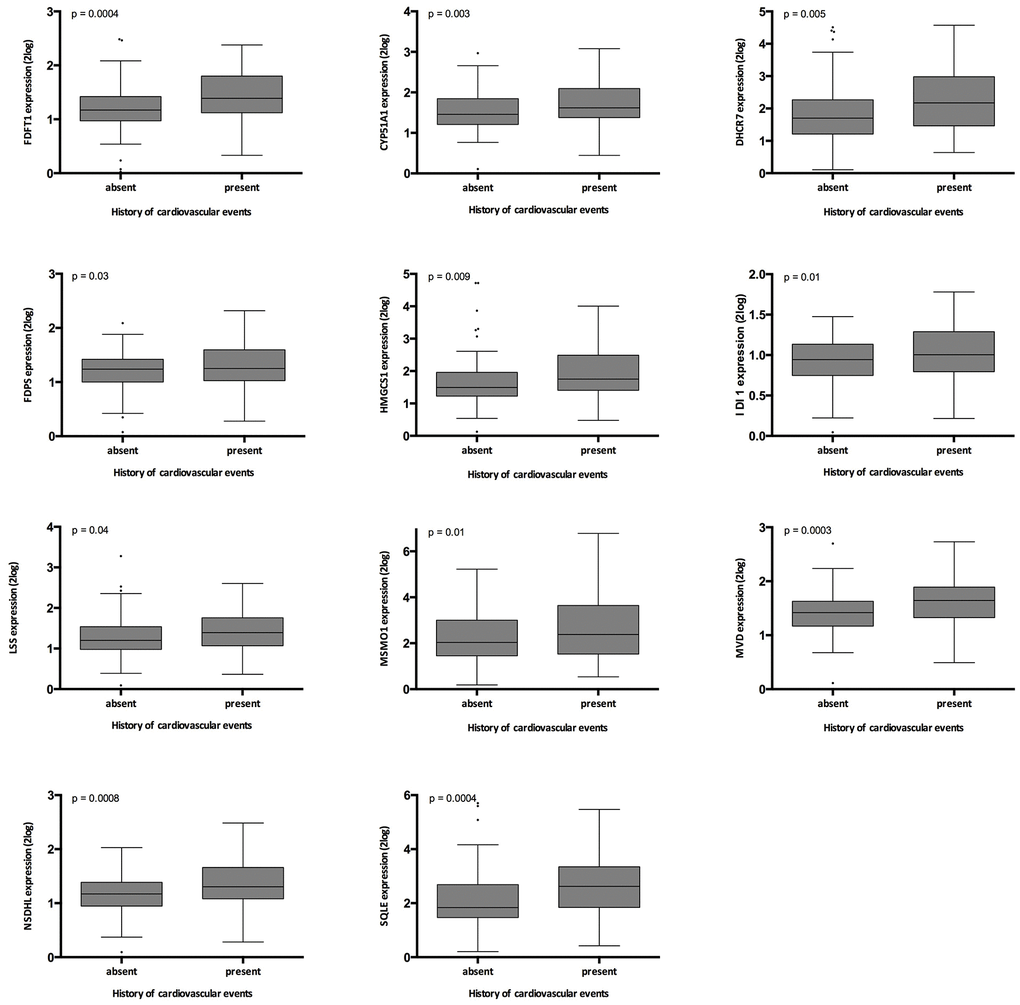
Figure 5.Relation between history of cardiovascular events in the validation cohort and gene expression. The p-values represent non-parametric ANOVA. The horizontal lines within the boxes indicate means, the upper and lower ends of the boxes indicate standard deviations, and the whiskers indicate 95th percentiles.