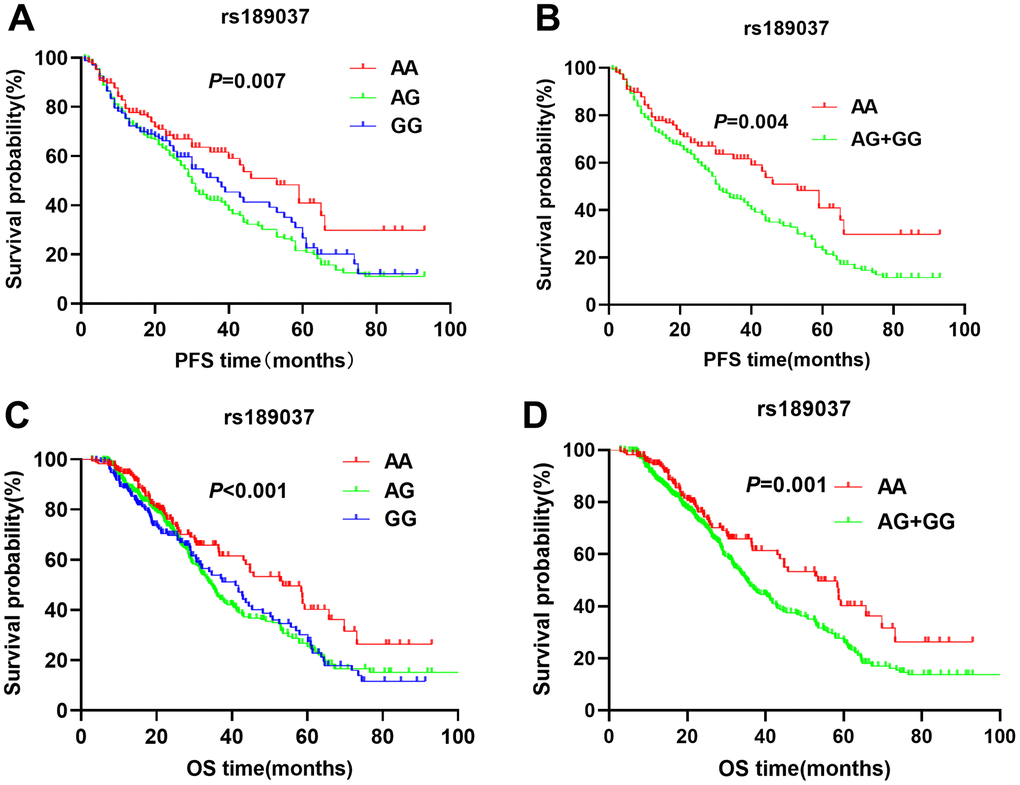
Figure 2.Kaplan-Meier survival curve analysis shows disease-free survival (A) AA vs. AG vs. GG, (B) AG/GG vs. AA; and overall survival (C) AA vs. AG vs. GG, (D) AG/GG vs. AA, of NSCLC patients with ATM rs189037 genotypes that are treated with radiation or chemoradiation therapies.