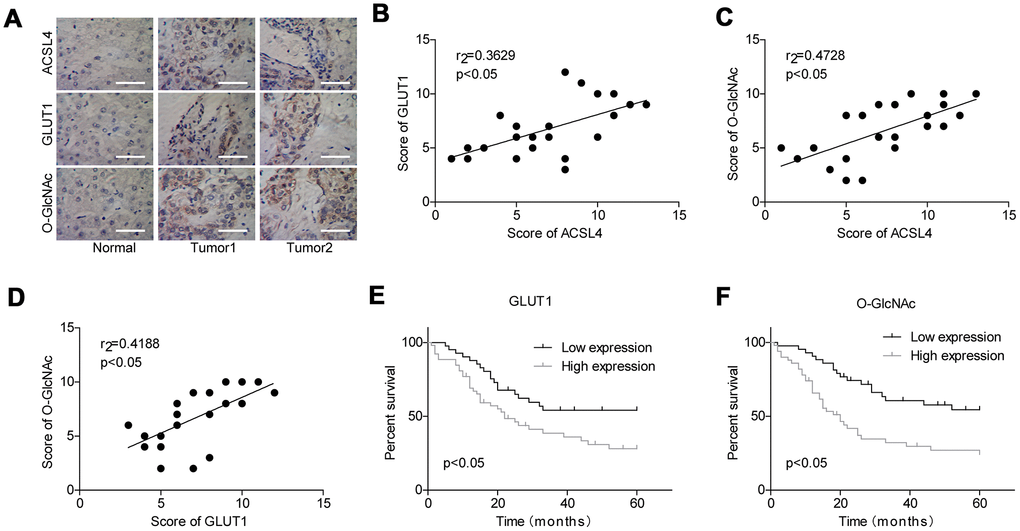
Figure 6.Evaluation of the levels of GLUT1 and O-GlcNAc in HCC and their clinical significance. (A) Immunohistochemistry technology was used to assess the protein levels of ACSL4, O-GlcNAc and GLUT1 in HCC tissues and adjacent normal tissues (Scale bar = 100 μm). (B–D) Pearson correlation analysis of the correlations between the levels of ACSL4, O-GlcNAc and GLUT1 in HCC tissues. (E, F) Kaplan-Meier analysis of the relationship between GLUT1/O-GlcNAc levels and the overall survival of patients with HCC.