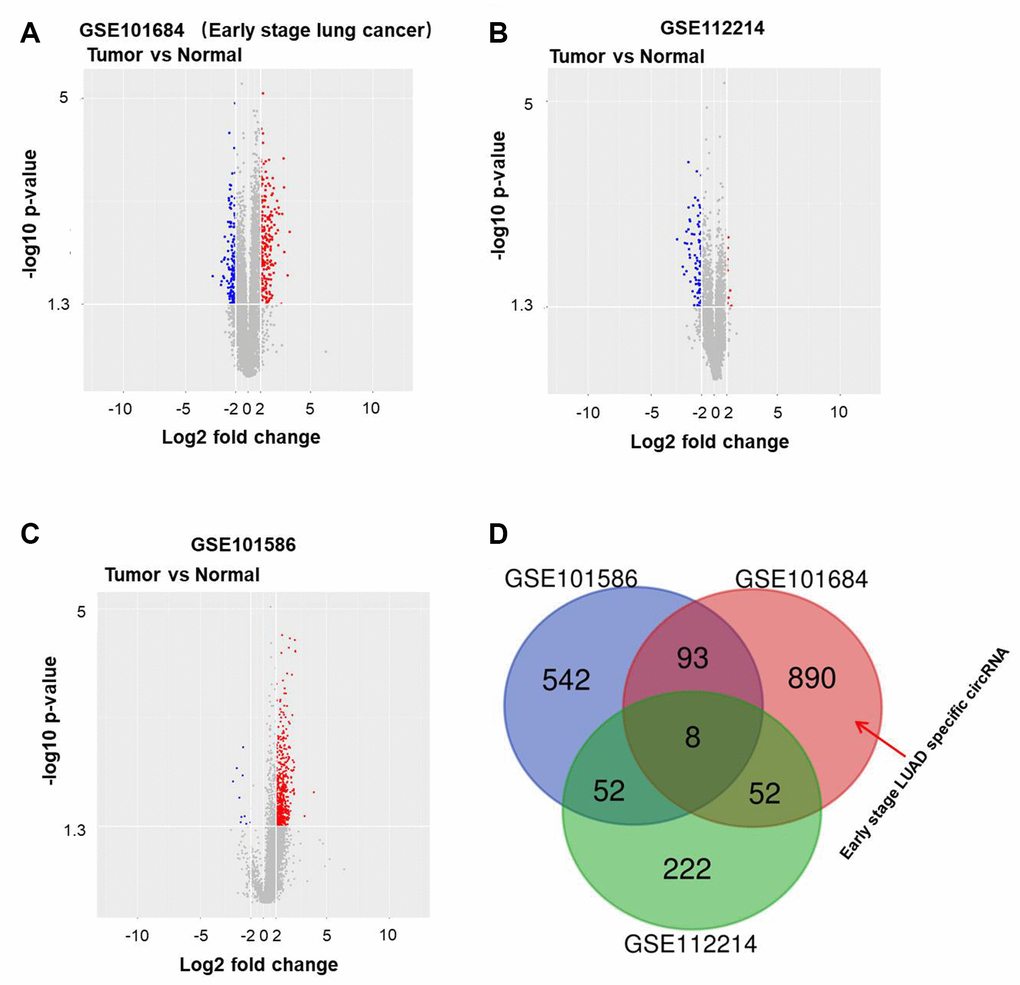
Figure 1.Differentially expressed circRNAs in NSCLC. Volcano plots illustrating the circRNAs differentially expressed in NSCLC detected in the (A) GSE101684, (B) GSE112214 and (C) GSE101586 datasets. Red indicates a higher expression level, while blue indicates a lower expression level. (D) Venn diagram showing the overlap among the differentially expressed circRNAs in the three datasets. In GSE101684, 890 circRNAs were related to NSCLC.