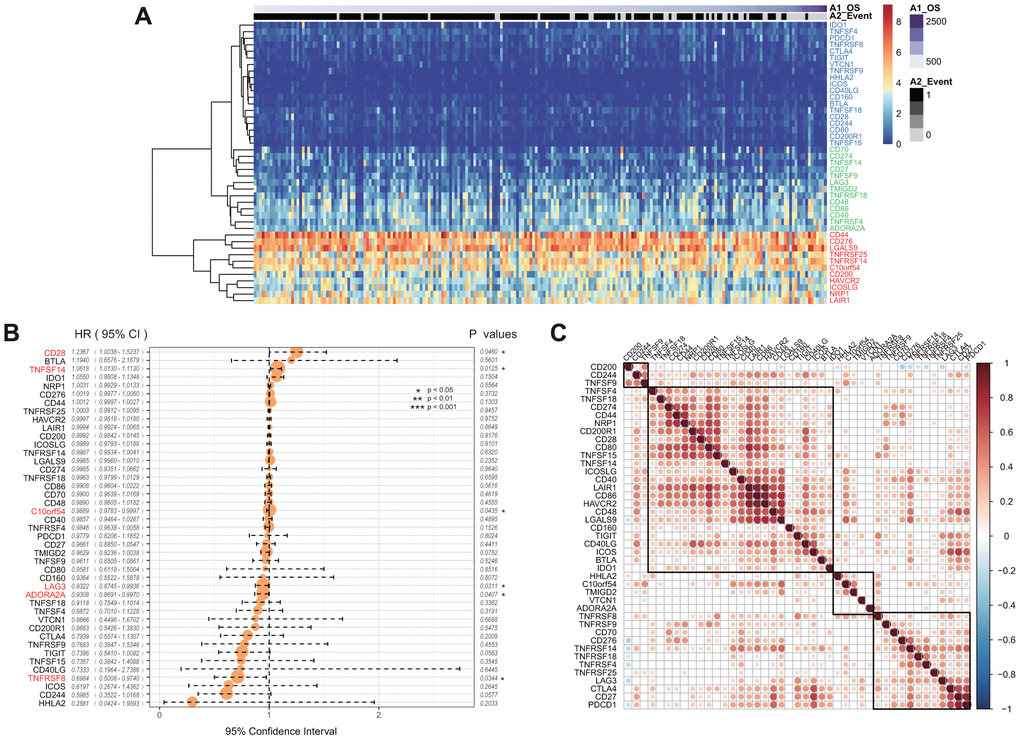
Figure 3.(A) The heatmap of ICGs expression in CGGA-GBM dataset. Red indicates the high expression group; green indicates the moderate expression group; blue indicates the low expression group. (B) The prognostic effect analyses of ICGs expression commonly used prognostic factors using univariate Cox regression model in CGGA-GBM dataset. (C) Correlation of ICGs expression level in CGGA. Note: Only the correlation test significant gene pairs were shown. The blank means that the correlation test is not significant.