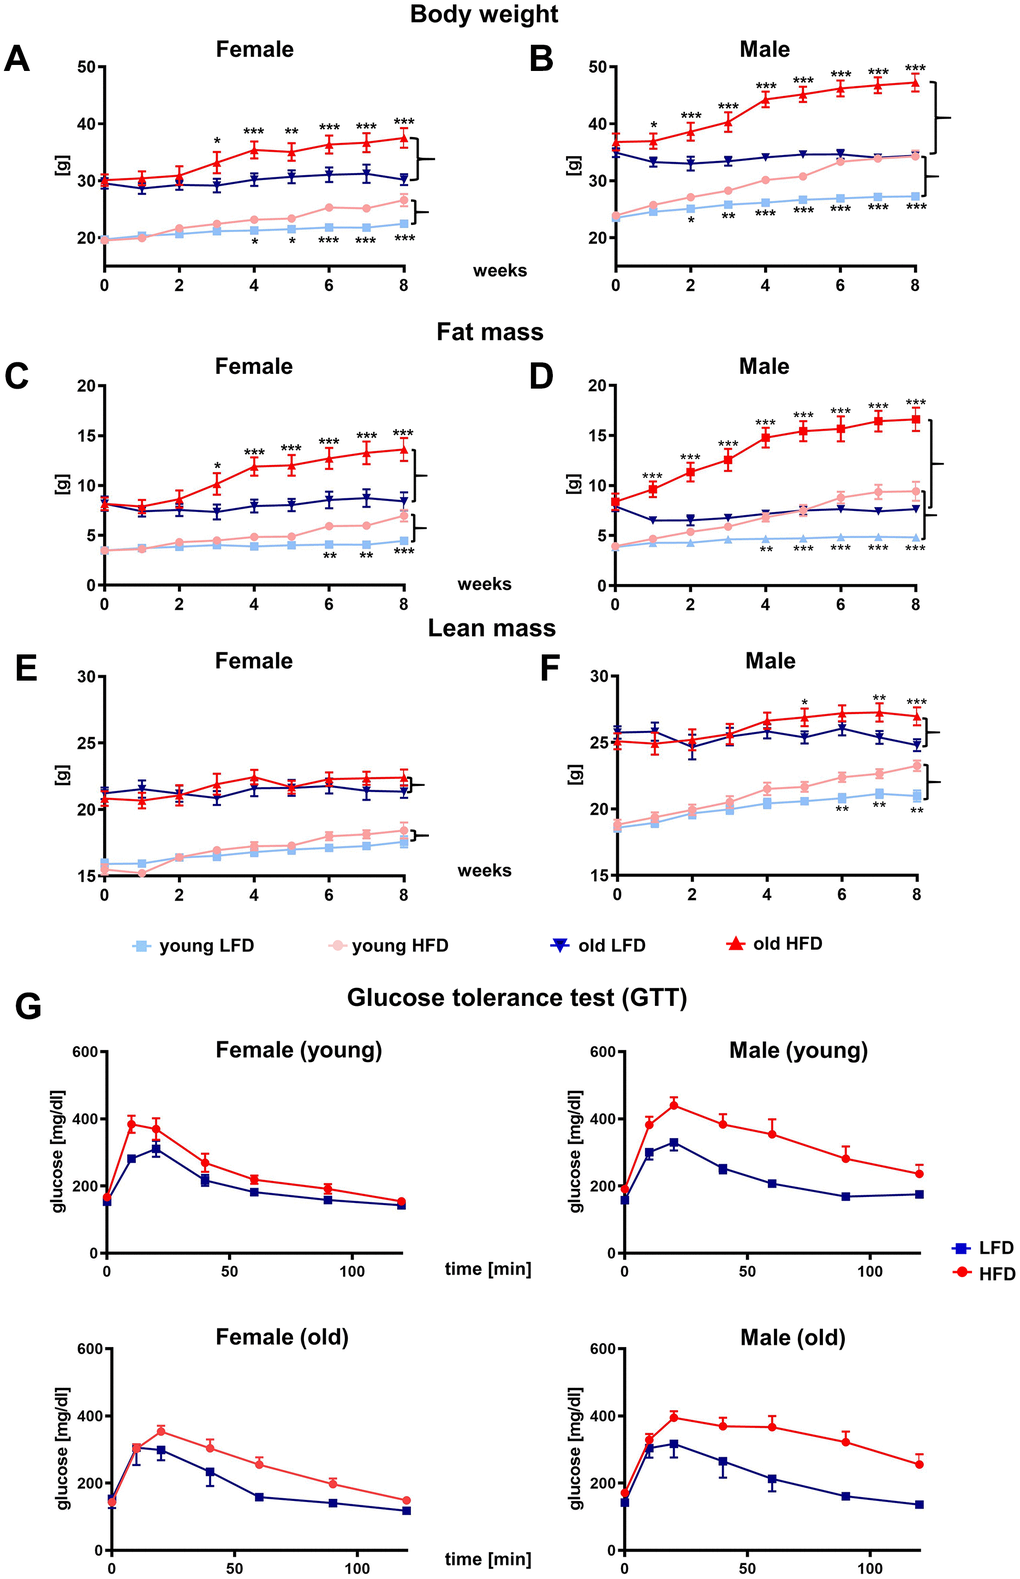
Figure 2.Effect of HFD vs. LFD on body weight (A, B), fat mass (C, D), lean mass (E, F) and glucose tolerance test (G) of B6 female (A, C, E, G) and male (B, D, F, G) mice. Body weight and body composition analyzed by nuclear magnetic resonance (NMR), were measured weekly during 8-week feeding study (n=192 total mice including: n=96 per LFD and n=96 per HFD). Data are the lsmean ±SE, asterisks indicate significant differences between animals fed HFD vs LFD *p<0.05, **p<0.01, ***p<0.001.