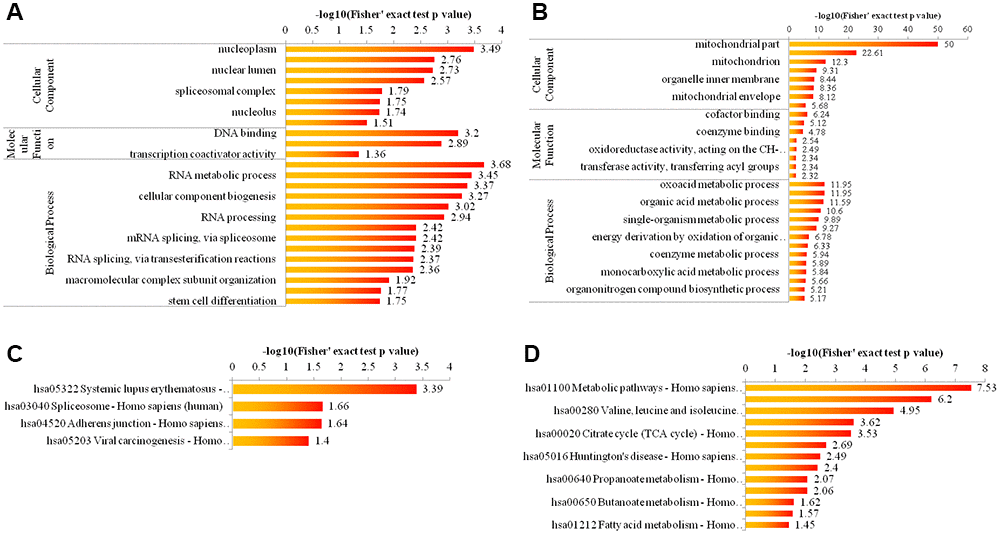
Figure 3.Bioinformatic analysis of acetylome quantification. (A, B) The enrichment of up- and down-regulated proteins in GO including cellular component analysis, biological process analysis, and molecular function analysis. (C, D) The enrichment of up- and down-regulated proteins in KEGG pathways.