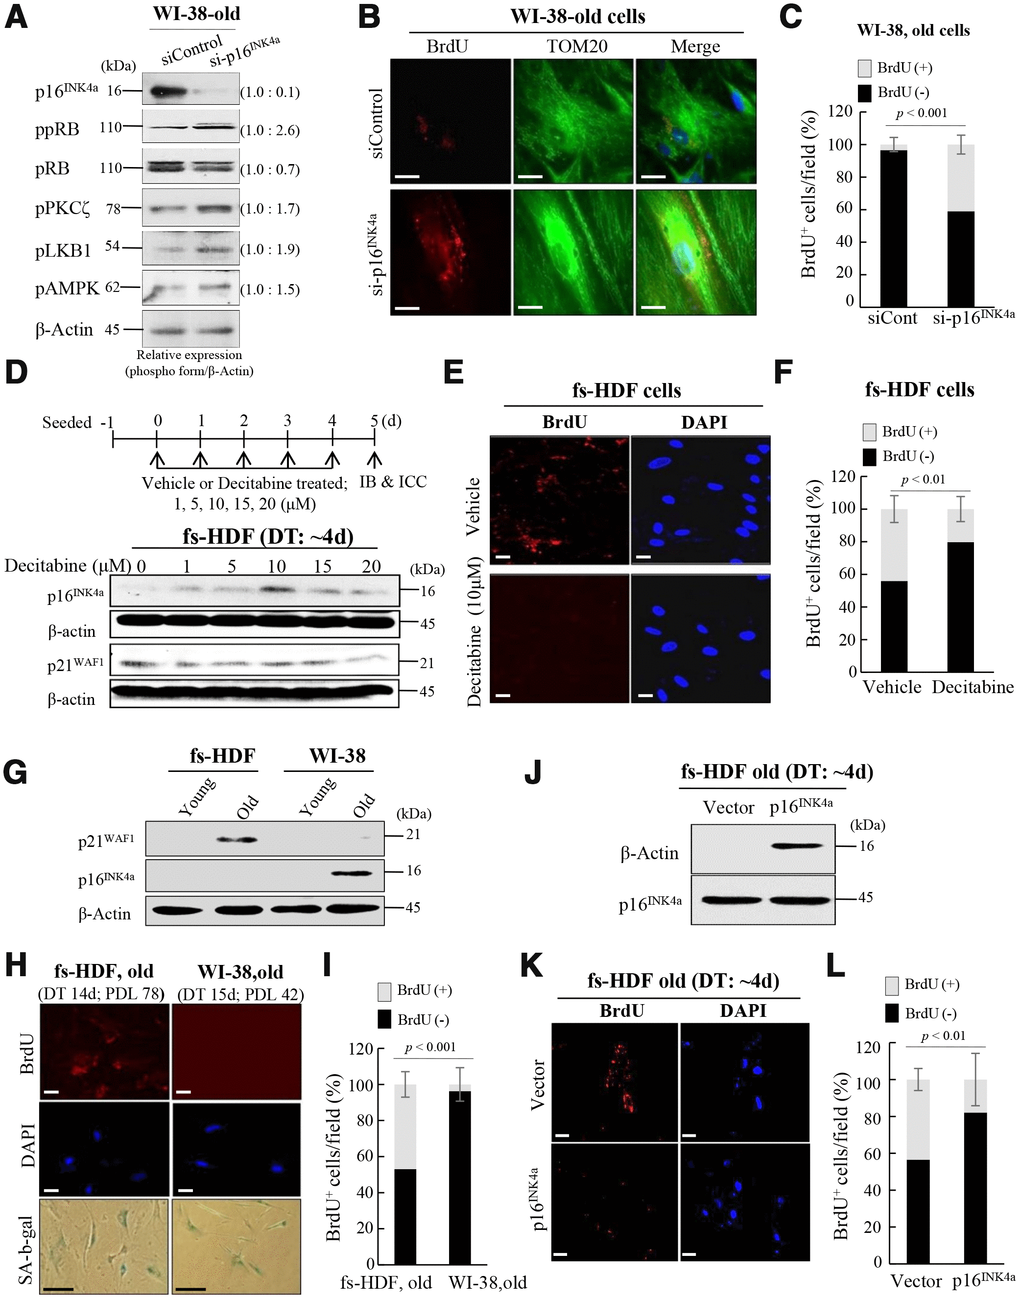
Figure 5.Silencing of p16INK4a or induction of p21WAF1 regulates mitochondrial remodeling in human fibroblasts. (A) Immunoblot analysis after knockdown of p16INK4a by transfection of old WI-38 cells with siRNA-p16INK4a. Note increase of pRB phosphorylation by knockdown of p16INK4a expression along with activation of the PKCζ-LKB1-AMPK signals. Band intensities were calculated by ImageJ software and normalized to that of β-Actin. (B) Knockdown of p16INK4a expression induced mitochondrial nucleoid formation in old WI-38 cells. Note anti-BrdU (red) and anti-Tom20 (green) expression in the siRNA-p16INK4a-transfected old WI-38 cells. Nuclei were stained with DAPI (blue). Scale bars, 10 μm. (C) Mitochondrial incorporation of BrdU was quantified. Confocal microscope images were captured and counted at least 120 cells using ImageJ software (n=6 images/group). (D) Induction of p16INK4a expression by repeated treatment of mid-old fs-HDF cells with decitabine (1–20 μM). The expression level of p16INK4a was higher after 5 days of 10 μM treatment, whereas that of p21WAF1 was constant. (E) Loss of mitochondrial nucleoid formation in fs-HDF mid-old cells treated with decitabine (10 μM) for 5 days. Scale bars, 20 μm. (F) Quantification of BrdU (+, -) mitochondria. Confocal microscope images were captured and counted at least 180 cells using ImageJ software (n = 8 images/group). (G) Significant induction of p21WAF1 expression in old fs-HDF cells, in contrast to p16INK4a expression in old WI-38 cells. (H) Comparison of old fs-HDF and old WI-38 cells. Note that 78 and 42 PDLs differed between the two cell types, respectively, despite the similar doubling times (DTs). Nucleoid remodeling was observed in the old fs-HDF cells, but not in the old WI-38 cells. Scale bars, 20 μm (white bar) or 100 μm (black bar). (I) Mitochondrial incorporation of BrdU was quantified. Confocal microscope images were captured and counted at least 180 cells using ImageJ software (n=9 images/group). (J) Mid-old fs-HDF cells were transfected with pCMV-p16INK4 and subjected to immunoblot analysis. (K) Loss of mitochondrial nucleoid formation in mid-old fs-HDF cells after forced expression of p16INK4 gene for 6 days. Scale bars, 20 μm. (L) Mitochondrial incorporation of BrdU was quantified. Confocal microscope images were captured and counted at least 150 cells using ImageJ software (n=7 images/group).