Submit an Article
Navigate
Home
Editorial Board
Editorial Policies
Current Volume
Archive
Scientific Integrity
Publication Ethics Statements
Interviews with Outstanding Authors
Newsroom
Sponsored Conferences
Podcast
Contact
Special Collections
Submit an Article
Online ISSN: 1945-4589
Research Paper
|
Volume 12, Issue 7
|
pp. 6260–6275
Myotonic dystrophy type 1 cells display impaired metabolism and mitochondrial dysfunction that are reversed by metformin
Back to article
Figure 4
(4 of 7)
−
100%
+
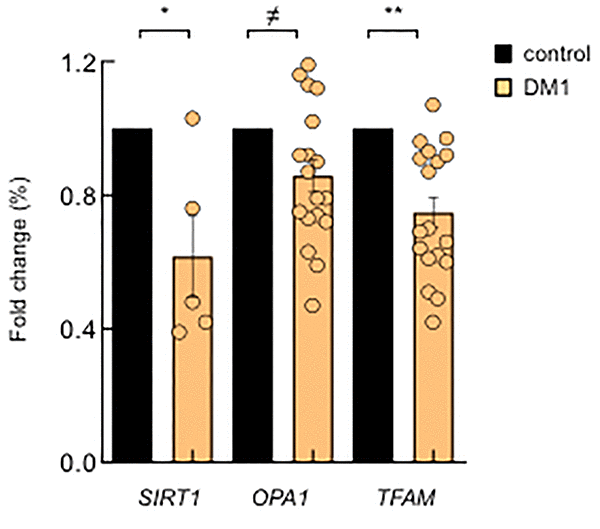
Figure 4.
DM1-derived blood samples also show mitochondria dysfunction.
mRNA levels of
SIRT1
,
OPA1
and
TFAM
in PBMCs derived from DM1 (n≥12) and controls (n=4).