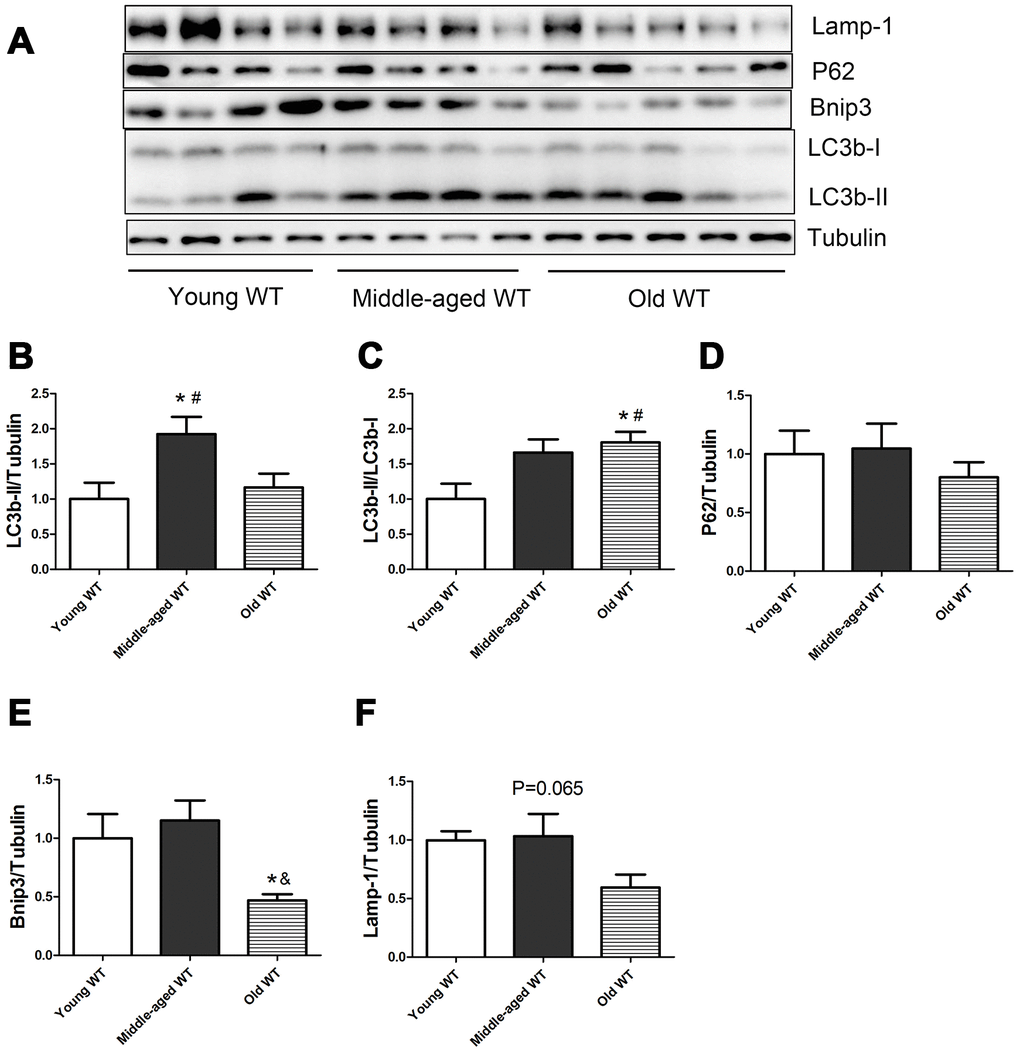
Figure 1.Expression of LC3b-II, LC3b-I, P62, Bnip3, and Lamp-1 proteins in young WT, middle-aged WT, and old WT mice. (A) Western blot images. (B–F) Statistical graphs. Data represent mean ± SE, (n=4-5). *P <0.05 effect of age by one-way ANOVA. #P <0.05 compared with young WT mice. &P <0.05 compared with middle-aged WT mice.