Submit an Article
Navigate
Home
Editorial Board
Editorial Policies
Current Volume
Archive
Scientific Integrity
Publication Ethics Statements
Interviews with Outstanding Authors
Newsroom
Sponsored Conferences
Podcast
Contact
Special Collections
Submit an Article
Online ISSN: 1945-4589
Research Paper
|
Volume 12, Issue 7
|
pp. 5907–5919
Increased intrinsic default-mode network activity as a compensatory mechanism in aMCI: a resting-state functional connectivity MRI study
Back to article
Figure 5
(5 of 5)
−
100%
+
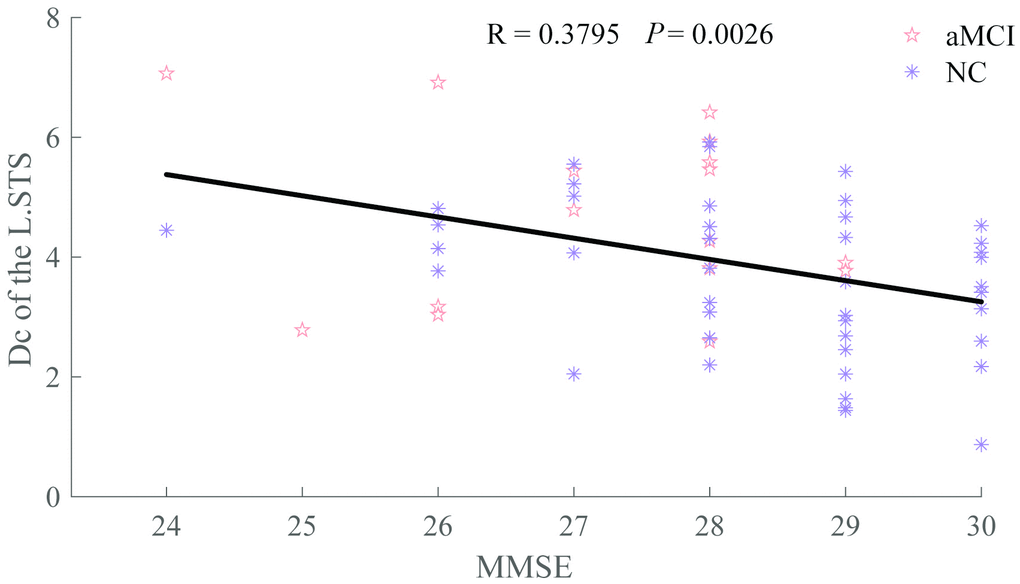
Figure 5.
Relationship between Dc of the L.STS and MMSE.
The patient group is indicated by the Indian red pentagrams and the normal group by dark orchid asterisks.