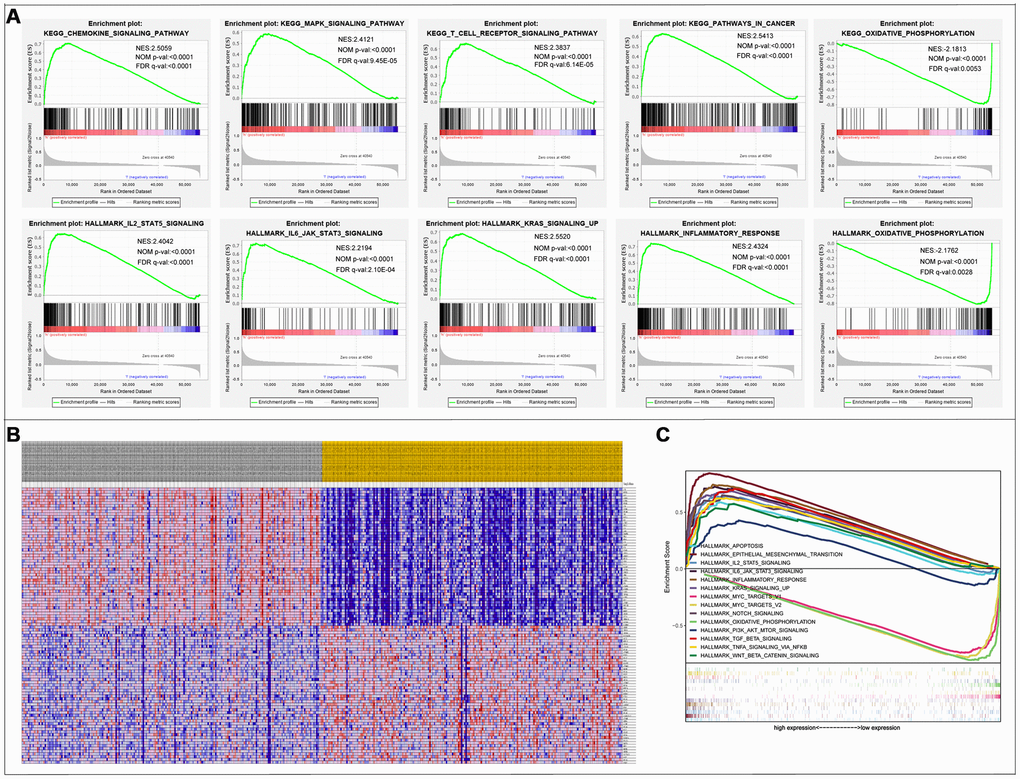
Figure 6.Gene Set Enrichment Analysis. (A) 10 significantly enriched pathways. (B) Cluster heatmap of top 50 high and low expressed genes in all samples. (C) Comparative analysis of the top 10 significantly enriched pathways.
Figure 6 — Development of a prognostic index and screening of potential biomarkers based on immunogenomic landscape analysis of colorectal cancer | Aging