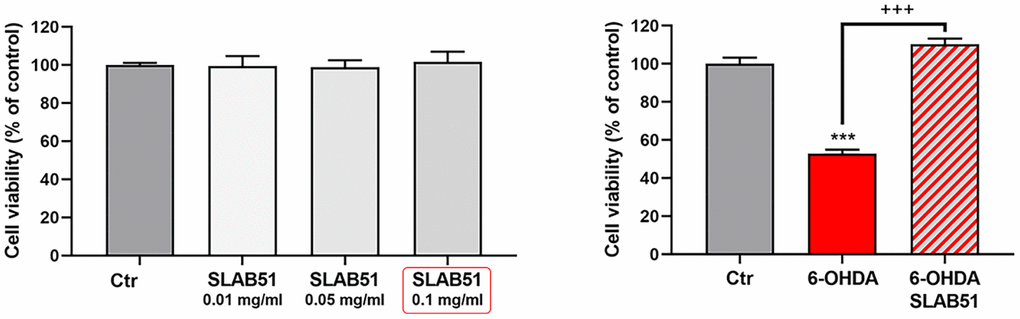
Figure 2.MTS assay of cells treated with different concentration of SLAB51 (left). MTS assay of cells treated with 35 μM 6-OHDA and 35 μM 6-OHDA and SLAB51 0.1mg/ml (right). Data are mean ± SE of three different experiments run in quadruplicate (n=3). *** p< 0.0005 vs Ctr; +++ p< 0.0005 vs 6-OHDA.