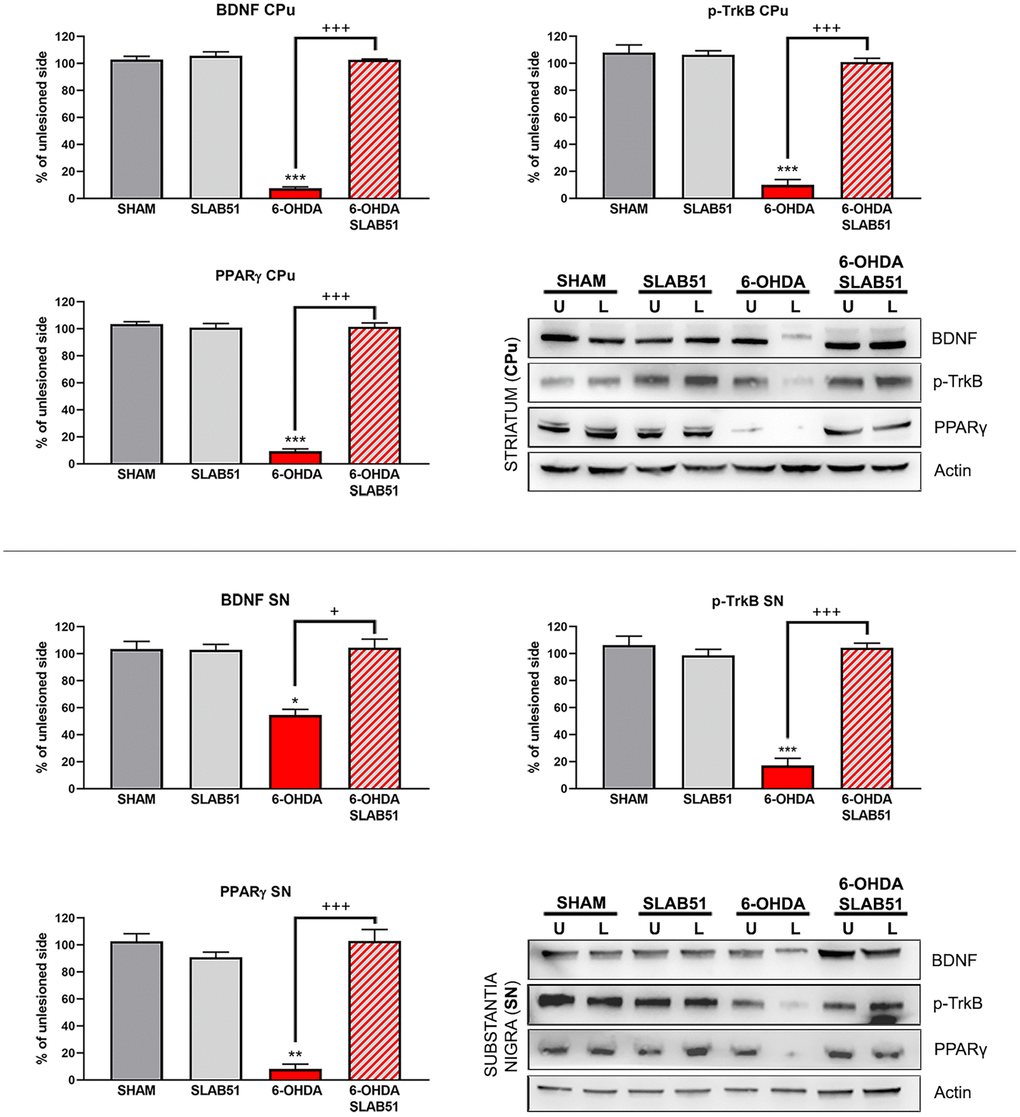
Figure 12.Western blotting and relative densitometric analysis for mBDNF, p-TrkB and PPARγ in substantia nigra (SN) and striatum (CPu). Results are mean ± SE of 3 experiments (n=3). * p< 0.005, ** p< 0.005, *** p< 0.0005 vs Ctr; + p< 0.005, +++ p< 0.0005 vs 6-OHDA. Representative WB images are shown.