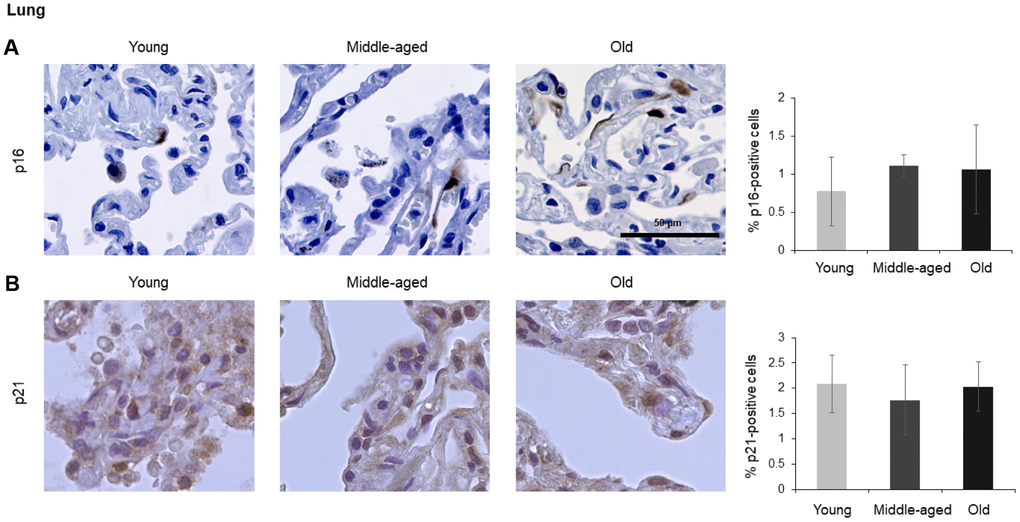
Figure 8.Lung. Cells expressing p16 (A) or p21 (B) were identified by IHC staining in the lung from Young, Middle-aged, and Old donors. Graph represents the quantification (%) of p16-positive cells (A) and p21-positive cells (B) from 5 tissue cores from independent donors per organ and age group; data represent the means ±SD from 5 different donors.