Submit an Article
Navigate
Home
Editorial Board
Editorial Policies
Current Volume
Archive
Scientific Integrity
Publication Ethics Statements
Interviews with Outstanding Authors
Newsroom
Sponsored Conferences
Podcast
Contact
Special Collections
Submit an Article
Online ISSN: 1945-4589
Research Paper
|
Volume 12, Issue 5
|
pp. 4463–4473
Role of eotaxin-1/CCL11 in sepsis-induced myocardial injury in elderly patients
Back to article
Figure 2
(2 of 6)
−
100%
+
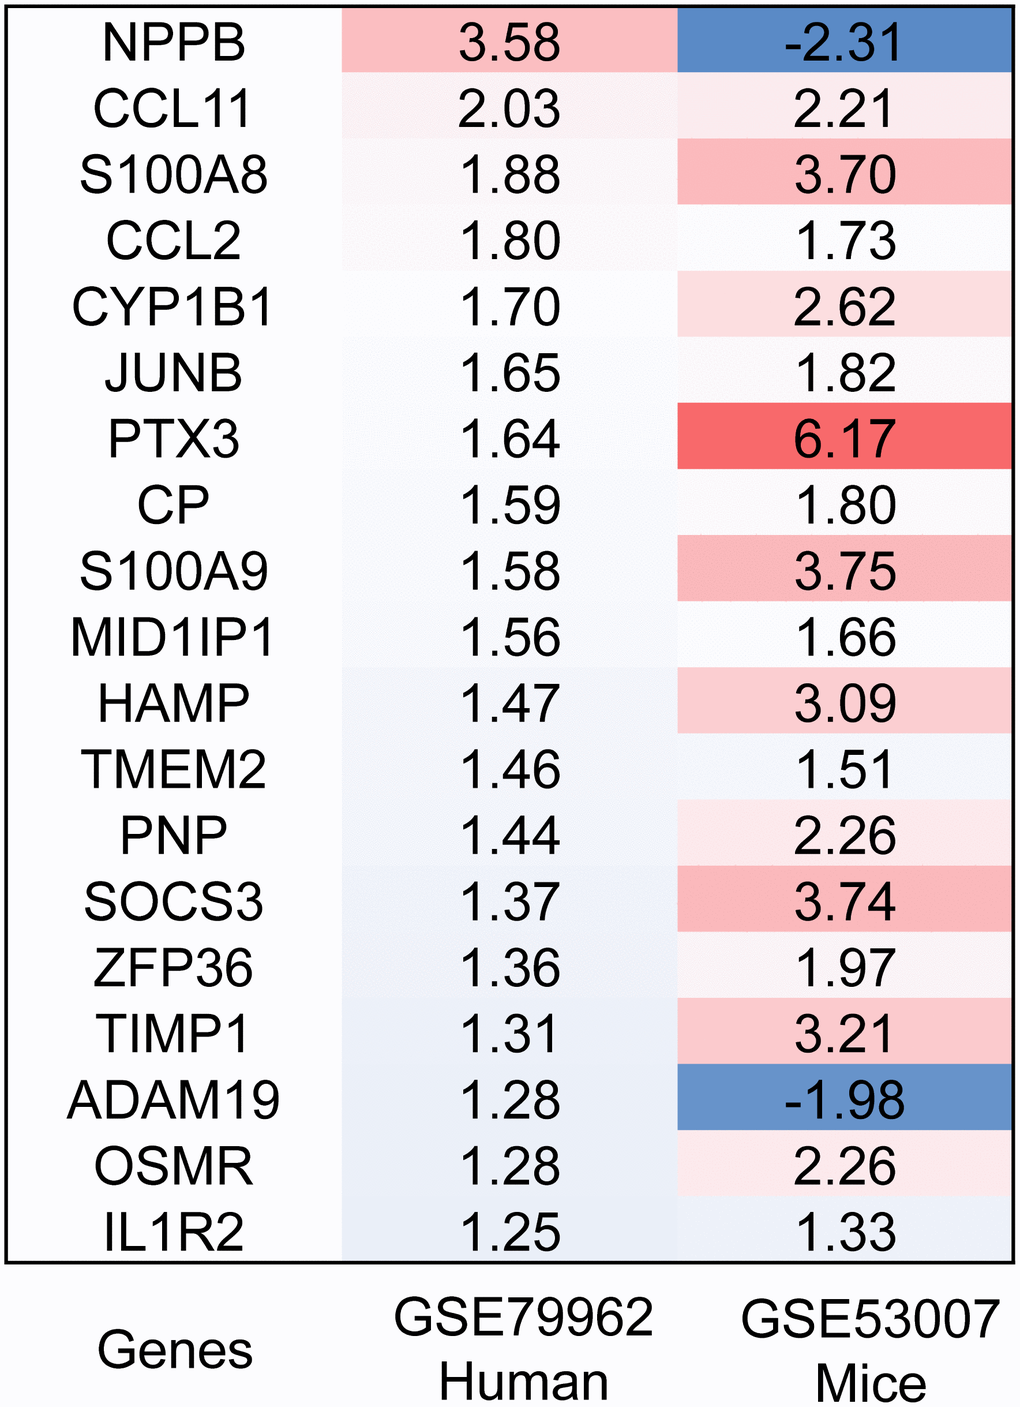
Figure 2.
Heatmap of DEGs.
The expression levels of the 19 overlapped genes in human and mouse sepsis-injured myocardium. DEGs, differentially expressed genes. Red, greater expression. Blue, less expression.