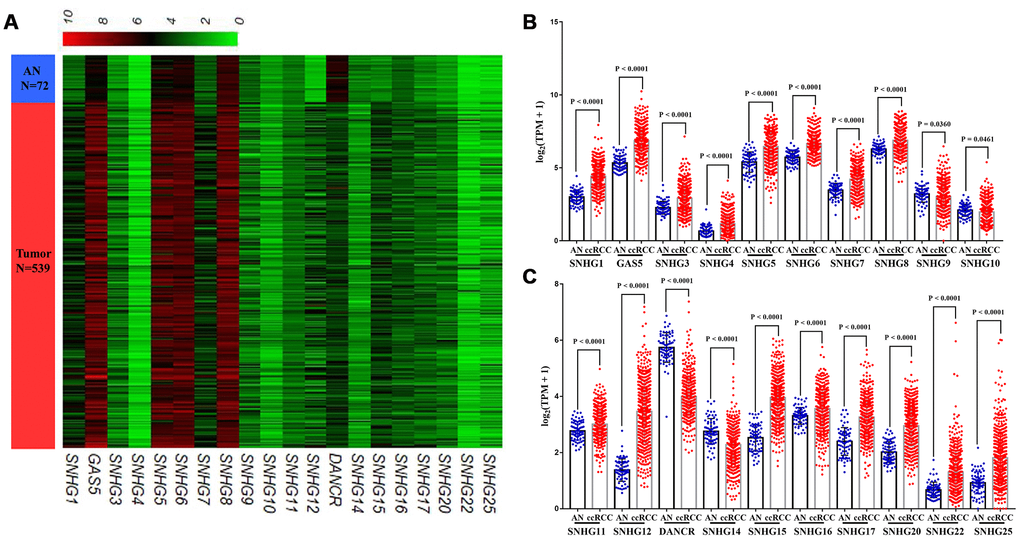
Figure 2.Expression profiles of lncRNAs encoding snoRNA in ccRCC. (A) Heatmap, (B, C) Plots chart showing the expression profile of correlation between SNHG1, GAS5, SNHG3-12, DANCR, SNHG14-17, SNHG20, SNHG22 and SNHG25 between ccRCC tissues and matched adjacent (adj.) normal (AN) tissues.