Submit an Article
Navigate
Home
Editorial Board
Editorial Policies
Current Volume
Archive
Scientific Integrity
Publication Ethics Statements
Interviews with Outstanding Authors
Newsroom
Sponsored Conferences
Podcast
Contact
Special Collections
Submit an Article
Online ISSN: 1945-4589
Research Paper
|
Volume 12, Issue 5
|
pp. 4379–4393
Genetic variants in
RET
,
ARHGEF3
and
CTNNAL1
, and relevant interaction networks, contribute to the risk of Hirschsprung disease
Back to article
Figure 1
(1 of 3)
−
100%
+
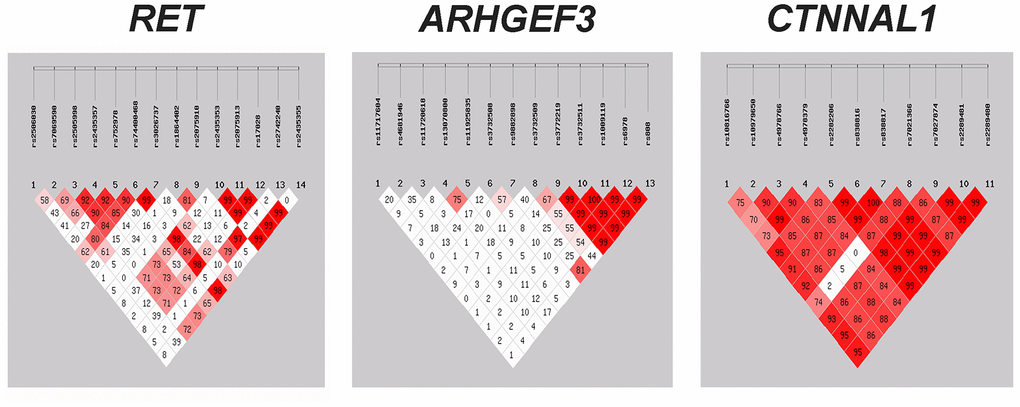
Figure 1.
Assessment of linkage disequilibrium (LD) between the genetic variants within
RET, ARHGEF3
and
CTNNAL1
.
The matrices represent the
D'
value between the SNP pairs. Red matrices denote
D'
> 70%. SNP = single nucleotide polymorphism.