Submit an Article
Navigate
Home
Editorial Board
Editorial Policies
Current Volume
Archive
Scientific Integrity
Publication Ethics Statements
Interviews with Outstanding Authors
Newsroom
Sponsored Conferences
Podcast
Contact
Special Collections
Submit an Article
Online ISSN: 1945-4589
Research Paper
|
Volume 12, Issue 5
|
pp. 4348–4356
Brain hemodynamic changes in amnestic mild cognitive impairment measured by pulsed arterial spin labeling
Back to article
Figure 1
(1 of 2)
−
100%
+
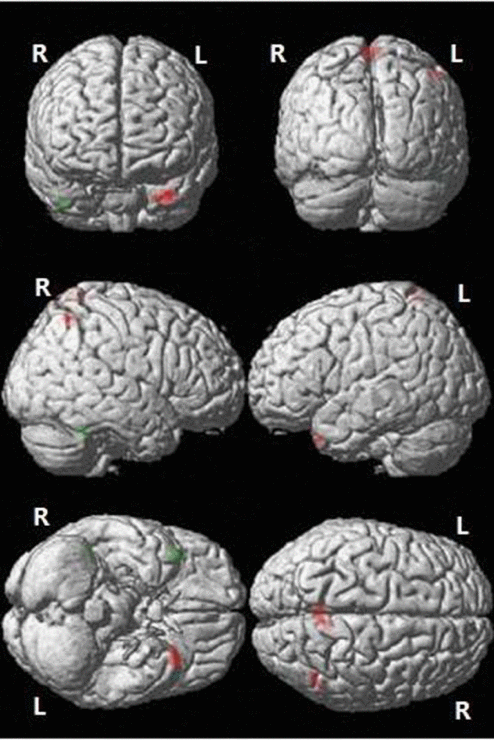
Figure 1.
Differences in CBF between the aMCI and NC groups.
Green: Decreased CBF in the aMCI compared to NC group; Red: Increased CBF in the aMCI compared to NC group (P < 0.05, AlphaSim corrected, cluster size ≥ 76 voxels). R: right; L: left.