Submit an Article
Navigate
Home
Editorial Board
Editorial Policies
Current Volume
Archive
Scientific Integrity
Publication Ethics Statements
Interviews with Outstanding Authors
Newsroom
Sponsored Conferences
Podcast
Contact
Special Collections
Submit an Article
Online ISSN: 1945-4589
Research Paper
|
Volume 12, Issue 5
|
pp. 4283–4298
Secondary injury to distal regions after intracerebral hemorrhage influence neurological functional outcome
Back to article
Figure 4
(4 of 7)
−
100%
+
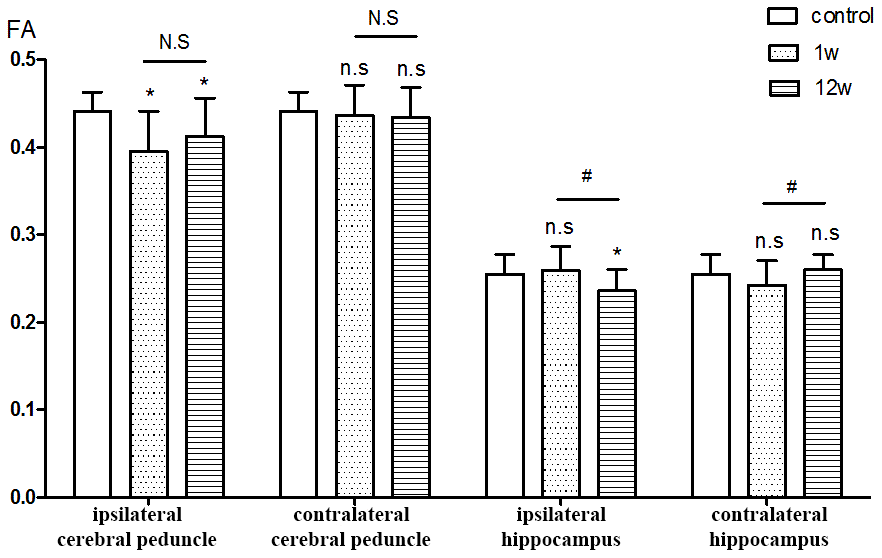
Figure 4.
ROIs analysis of FA value.
*P<0.05, compared with control group; n.s P>0.05 compared with control group; # P<0.05, compared with 1st w; N.S P>0.05 compared with 1st w.