Submit an Article
Navigate
Home
Editorial Board
Editorial Policies
Current Volume
Archive
Scientific Integrity
Publication Ethics Statements
Interviews with Outstanding Authors
Newsroom
Sponsored Conferences
Podcast
Contact
Special Collections
Submit an Article
Online ISSN: 1945-4589
Research Paper
|
Volume 12, Issue 5
|
pp. 4230–4246
Development, validation and clinical impact of a prediction model for 6-month mortality in older cancer patients: the GRADE
Back to article
Figure 2
(2 of 5)
−
100%
+
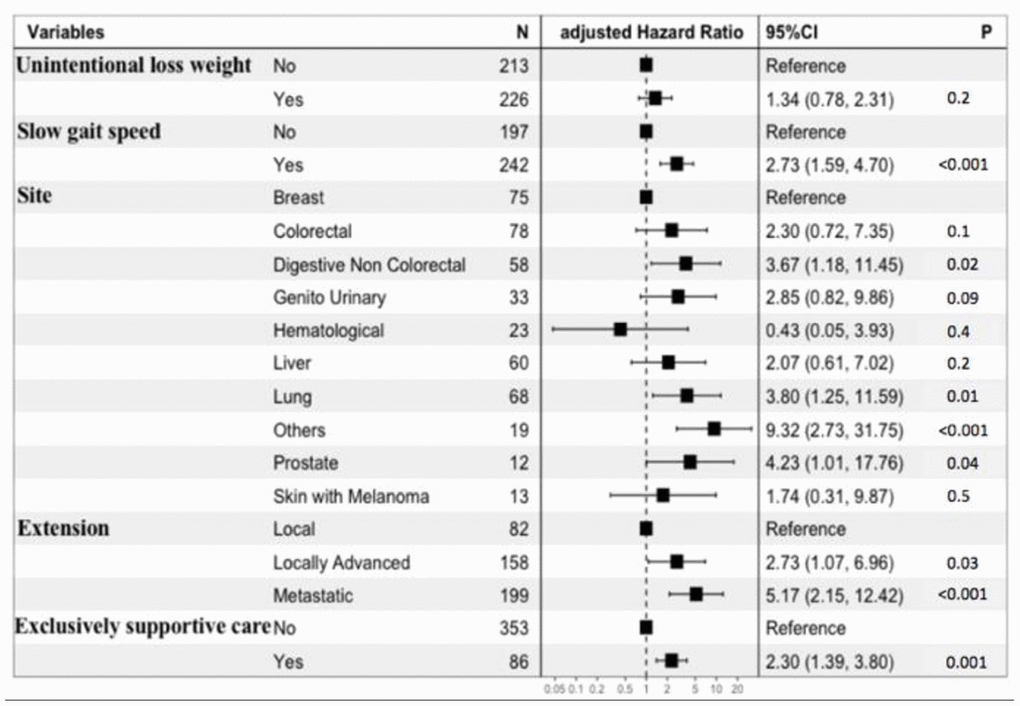
Figure 2.
Forest plot of the multivariate prediction model.