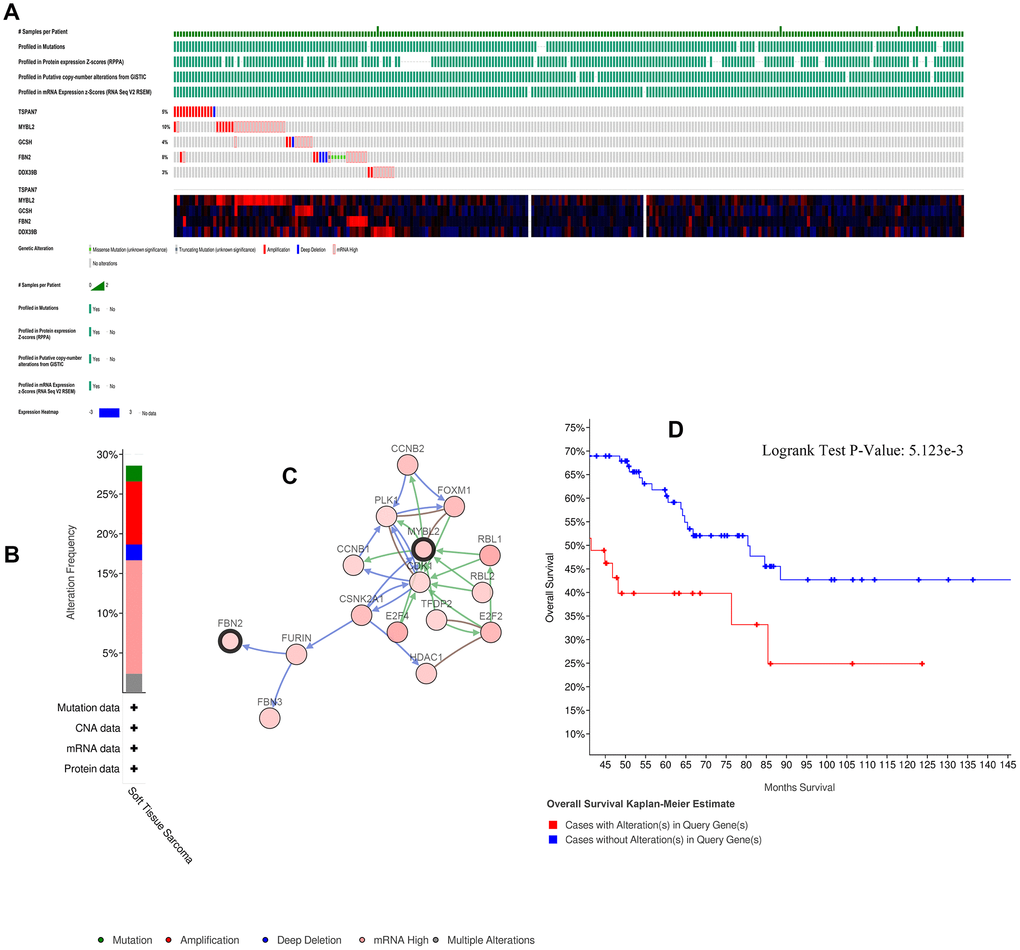
Figure 4.Alterations in expression of the five key genes. (A) 73 of 265 samples (28%) had alterations of the five key genes. (B) Frequencies of different alterations. (C) Network of key genes and most frequently altered neighbor genes. (D) Survival analysis for patients with and without alterations in the five key genes.