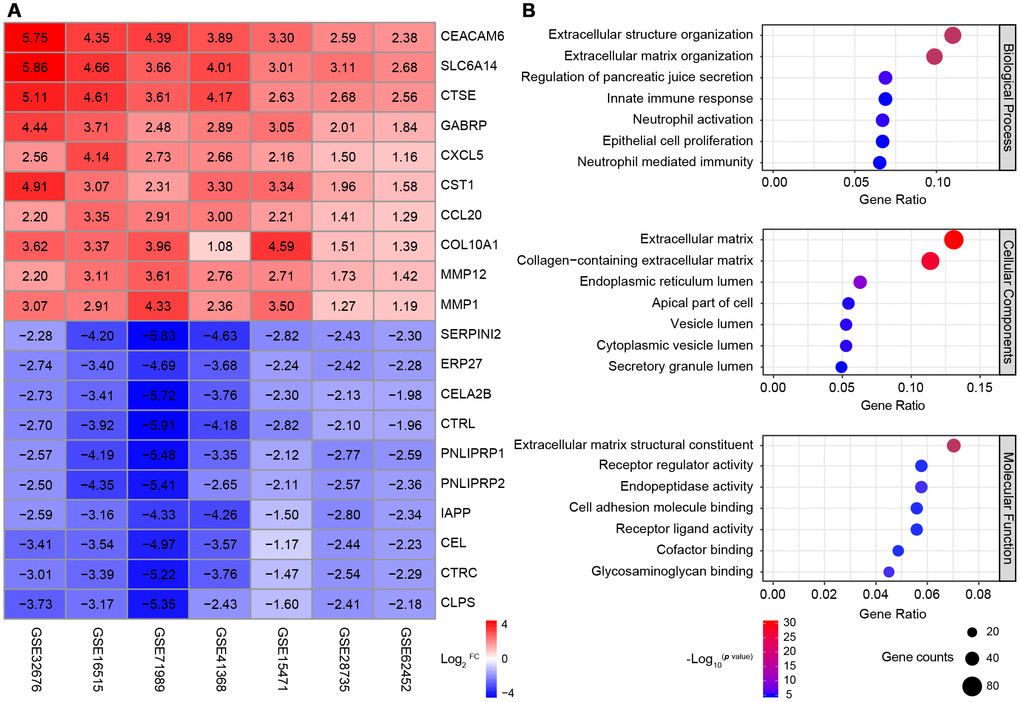
Figure 1.Identification and GO analysis of DEGs in seven PDAC datasets. (A) A heatmap of the top 10 significantly upregulated or downregulated genes. The expression of each gene in each dataset is shown in a colored box with the log2FC inset. Red and blue boxes indicate upregulated and downregulated genes, respectively, and the color saturation correlates with the gene level. (B) GO analysis of all the DEGs. The seven most enriched GO terms in each category (BP, CC and MF) are listed next to the left axis. The size of the circle indicates the number of enriched genes, and the color is associated with the respective -log10p value.