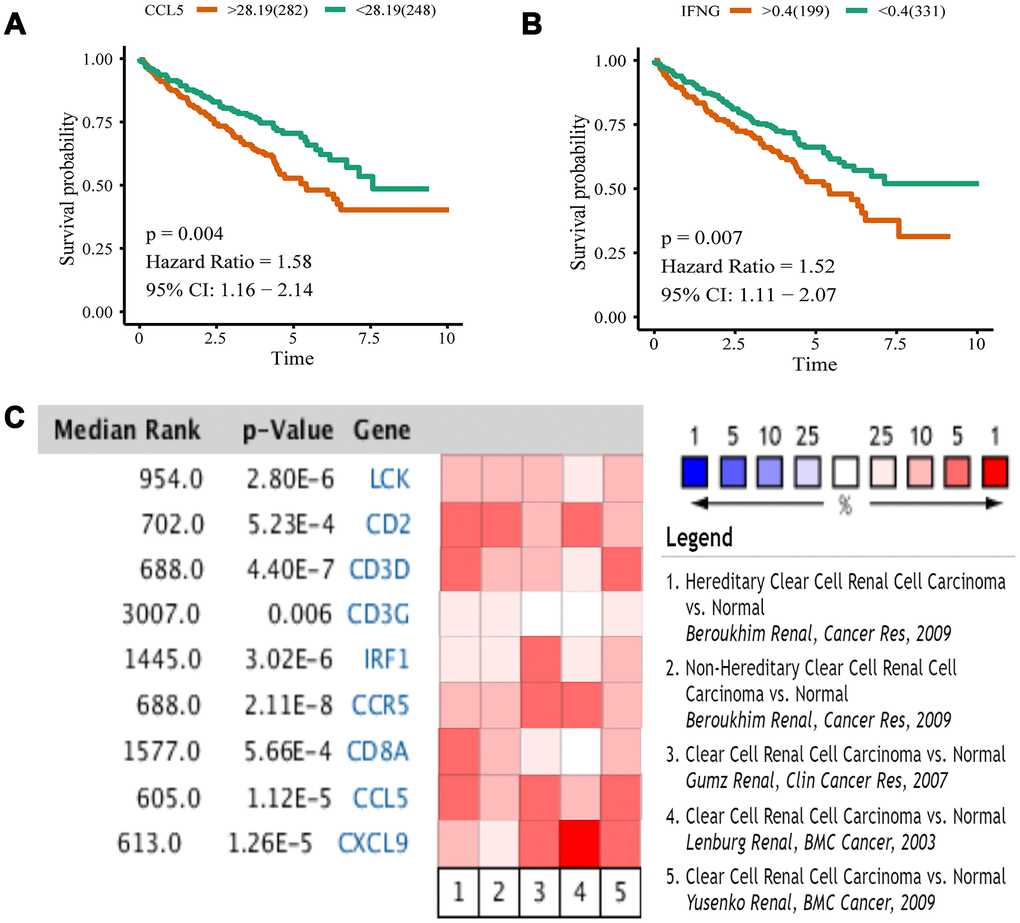
Figure 8.Kaplan-Meier analysis and Oncomine meta-analysis. (A) The overall survival analysis of CCL5. (B) The overall survival analysis of IFNG. (C) A meta-analysis of gene expression from Oncomine datasets. Colored squares represent the median of genes (relative to normal tissue) in five analyses. Red represents overexpression, blue represents low expression. This P value gives the average rank analysis.