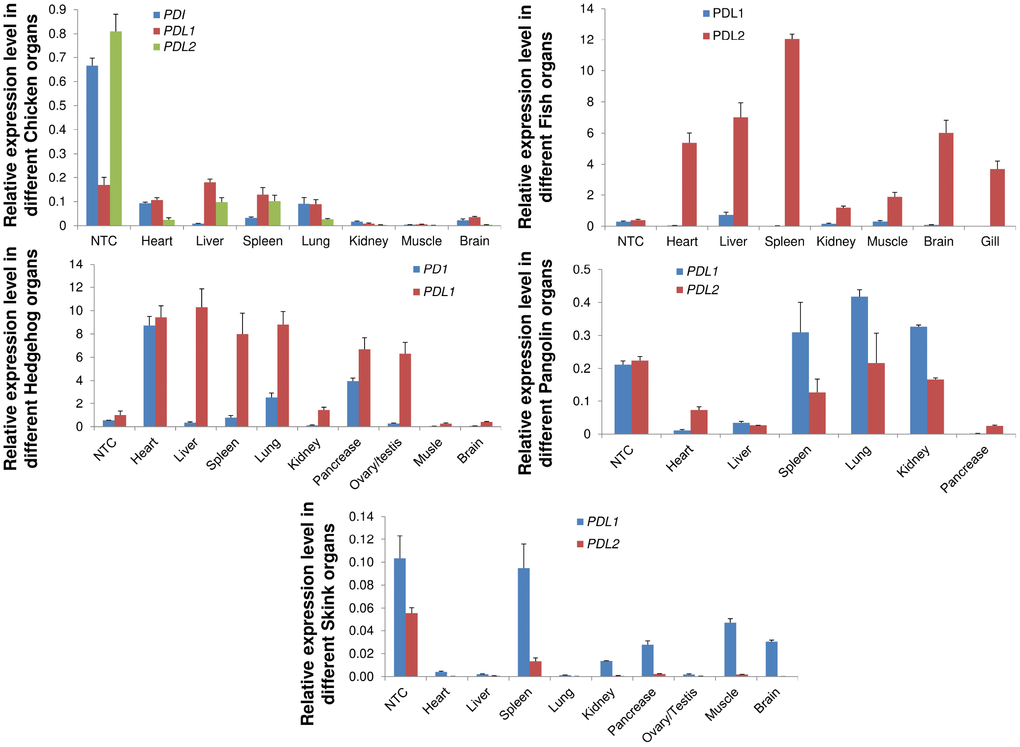
Figure 8.qRT-PCR analysis of PD1, PD-L1 and PD-L2 genes in different animal tissues. Expression patterns of genes in different tissues were examined. Heart, liver, spleen, lungs, kidney, pancreas, brain, were used for quantitative reverse transcription (qRT-PCR) polymerase chain reaction. Transcript levels are expressed relative to that of beta-actin. NTC: negative control.